Update on SciChart v1.2.1 Delivery
The SciChart v1.2.1 release is just around the corner! We’ve been working very hard incorporating features and fixes which you have requested since the first SciChart release on 18th Feb 2012, so thank you for getting in contact. You are helping us shape this high-performance WPF & Silverlight charting component so please keep the feedback coming.
We are in the final stages of testing before releasing an update. On the release date we will send out a newsletter email with the new binaries download link. If you haven’t done so already, we recommend you sign up to our newsletter as this is how we deliver content updates. Here is a quick recap on what will be delivered in the upcoming v1.2.1 release of SciChart.
New Features
- Sharing of ChartModifiers across multiple chart panes, e.g. SciTrader example RolloverModifier now works across price, volume panes
- StrokeThickness property added to FastLineRenderableSeries
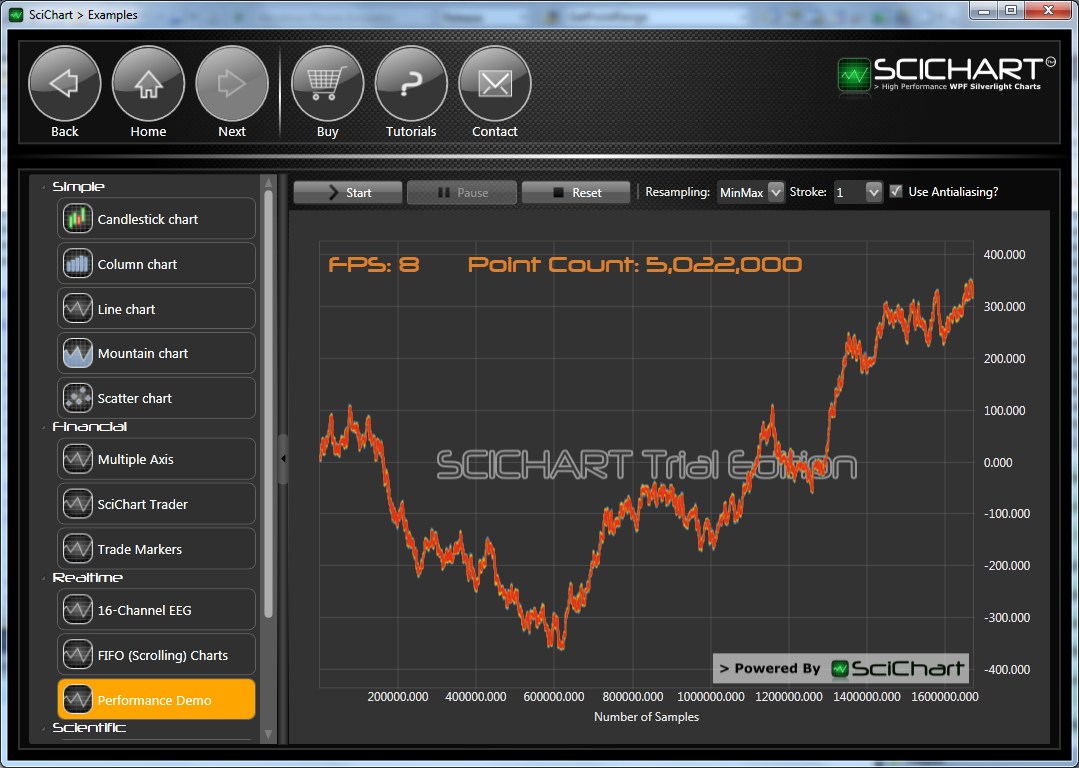
- Improved rendering quality, performance and latency. SciChart can now load >2M points in under 400ms and render 5,000,000 points at 8 FPS! (i7 core notebook, 4GB RAM)
- Point Markers – custom ControlTemplate rendered on datapoints
- Added XyScatterRenderableSeries, which uses a custom ControlTemplate to render scatter points
- XyLineRenderableSeries – allows line charts to reverse / change direction
- Rollover Markers – custom ControlTemplate rendered on mouseover
- Optional IsXAxisOnly mode for RubberBandZoomModifier
- New Chart Modifiers – MouseWheelZoomModifier, ZoomExtentsModifier
- Better MVVM support & API changes around Data / Renderable Series
- Better Xaml Styling support throughout
Bug Fixes
- Fixed ResamplingMode ignored on line series
- Fixed line drawn to zero at rightmost of chart
- Fixed crashes in DateTimeAxis
- Fixed incorrect tick calculation in DateTimeAxis where data has gaps (e.g. weekends in stock charts)
- Fixed DateTimeAxis ticks 1px out of sync with Gridlines in some cases
- Fixed crash bug “Cannot draw a Point Range of (0,0)”
- Fixed innaccuracy in RenderableSeries.HitTest, used by RolloverModifier to inspect data points
- Fixed 1px line in WPF poor rendering quality
- Fixed stuck X-Axis drag when zoomed in
- Fixed VisibleRange being ignored on startup
- Fixed crash bug when ZoomPanModifier was applied to FIFO charts
- Fixed clipping for series rendering when the series goes out of chart bounds
Examples / Documentation
- Complete new examples shell application for WPF and Silverlight. We will build this out to include example code and multiple simple examples to aid building applications with SciChart
- Created CHM class documentation file and XLM comments for all public API within SciChart
- Added Point Markers example
- Added Multiple Y Axis example
- Added Buy Sell trade overlays example
- Added Line and scatter series example
Wow! So a lot of growth in features and bug fixes in just 6 weeks since SciChart was first launched. One thing is for sure, high-performance real-time WPF charting is a hit. Our biggest positive feedback has been on performance so we are committed to keeping this our primary goal, while focusing on the niche area of Scientific / Financial charting. However, we are also going to be adding more rich features that many of you have come to expect will of course be beneficial.
In due course we’ll email the update and a link to our Roadmap for SciChart v1.3. If there’s anything you wish to see in future releases, just ask!
– SciChart Team
Related Posts
