SciChart WPF v8.2 Released!
We’ve moved over to a new format for communicating our releases and updates of our popular WPF Chart control, by […]
If you haven’t seen it yet, we are running a special offer on all products on our Buy-Now page for all purchases until the end of August. The first 100 orders which use the coupon code SUMMER-OF-SCI are discounted by 15%. So far approximately half have been claimed.
If you are trialling, or processing an order now, do hurry, the offer expires in just ten days, on the 31st August.
We have some exciting releases due soon, which are undergoing final stages of development. We hope to release twice in the next month or so. These will include:
Several bug fixes including memory leaks, resize performance problems and DirectX memory management. You can get this build now by going to our Nightly Build (NuGet) Server. We will be packaging this in an MSI installer with release notes shortly.
v3.2 is a major update? Yes. We have undertaken some pretty radical work for this release, which is still in development. What will it include?
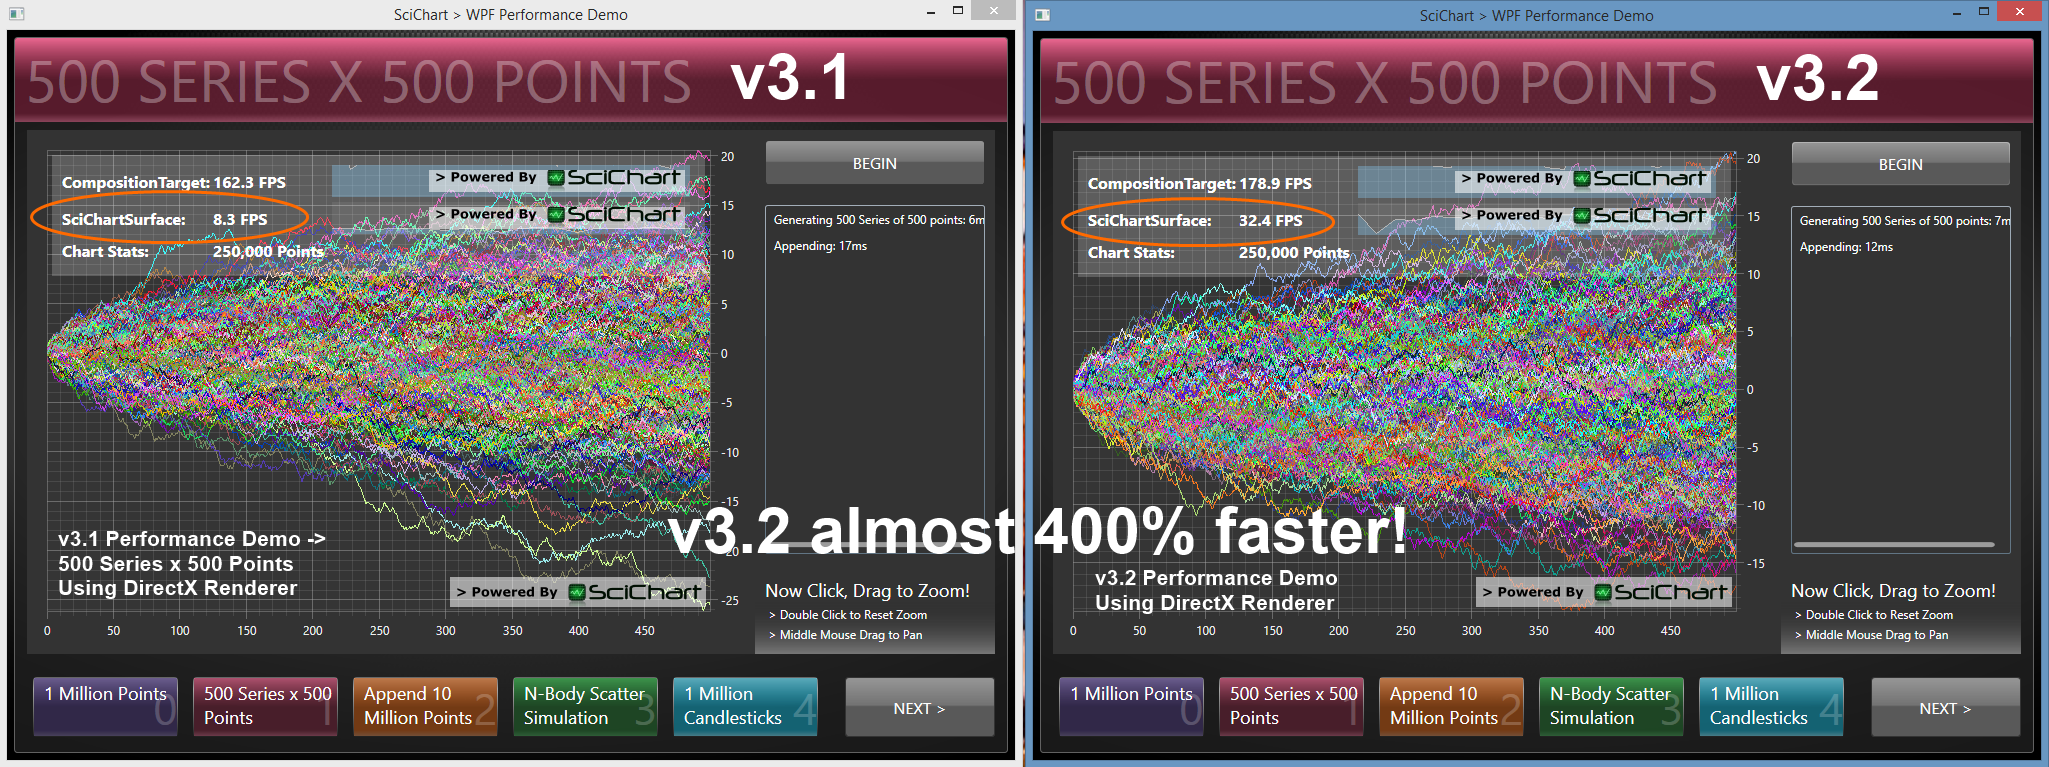
We’ve completely re-written the drawing pipeline, removing some long-standing bottlenecks and tightening up all the drawing code. The result? SciChart v3.2 will be faster, snappier and smoother than ever before… up to 4x faster in some cases :0
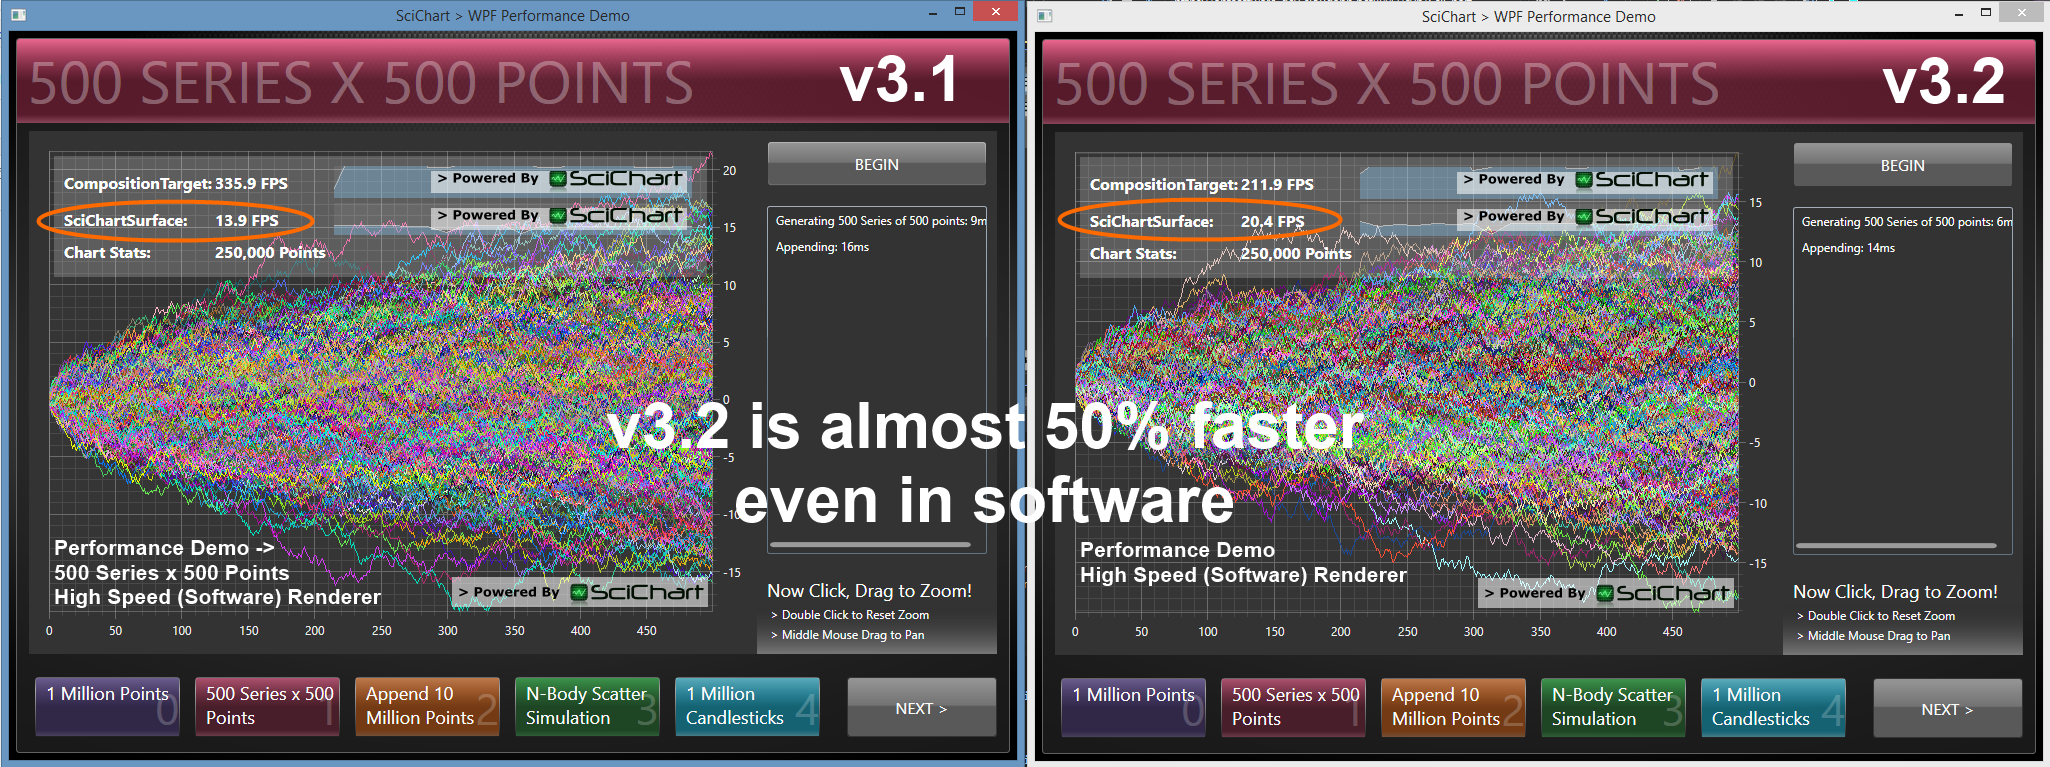
The improvements affect the rendering pipeline outside of Resampling, so if your chart is bottlenecked by resampling (e.g. you have one series with tens of millions of points) you will not notice much difference. However, if you have many series of several thousand points, or you use ResamplingMode.None, you should see a difference straight away. Take a look at the screenshots of our performance demo above. With the software renderer, SciChart v3.2 is benching at almost 50% faster, but with the D3D Renderer, the speed hike is almost 4x! We could barely believe our eyes ourselves!
Edit: We are told by an observant reader that 32.4 FPS / 8.3 FPS is not in fact “almost 400% faster”, but ‘almost 4x faster’, or more accurately +290%. In their defence, marketing said “we weren’t ever that good at maths, which is why we work in marketing, but check out this hilarious doge meme to describe the speed improvements in SciChart v3.2!”
We have also fixed performance issues when resampling and where TX (XAxis) data type was not Double, which resolves a critical performance bug in v3.1 reported on our forums.
How is this possible? Well, in v3.1 the chart was severely bottlenecked by coordinate transformation (converting output of Resampling to pixel coordinates), including accounting for NaN (gaps), paletted lines etc… This part of the code has been completely re-written and is faster and more lightweight than ever before. The actual drawing code has been significantly improved in the case of DirectX, but is about the same for the software renderer.

Faster performance means less CPU, longer battery life (on battery powered devices), allowing higher series/point counts and leaving more CPU available to crunch numbers in your applications, allowing your impossible charting projects to become possible.
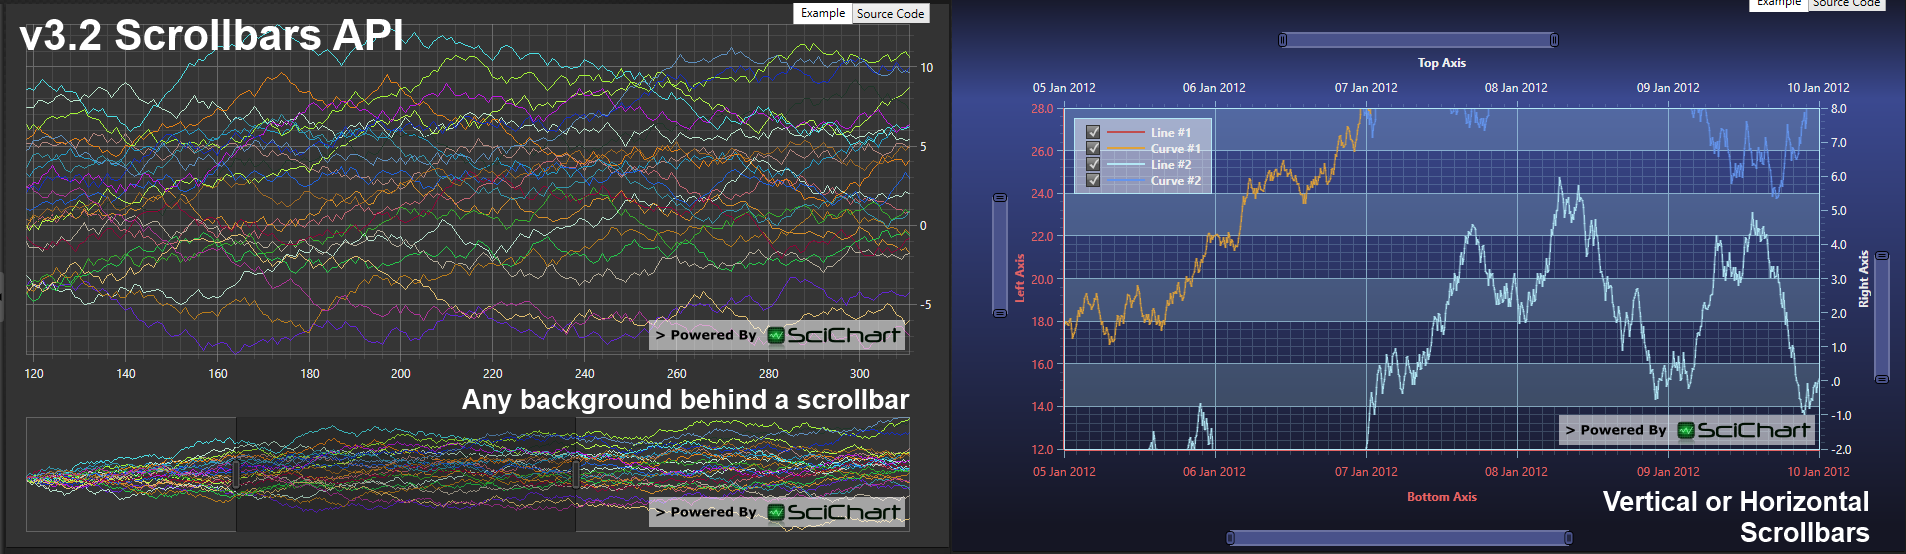
We’ve listened to feedback and included a vertical and horizontal per-axis Scrollbar. This will allow you to easily add scrollbars to your charts in 1 or 2 dimensions.
Many people have also asked us for the ability to show more than one series behind a SciChartOverview, or, to show an image. Well, using the soon to be released Scrollbar API you can! Simply declare a scrollbar, and behind it, a chart. Done!
We have enabled Palette Provider on FastMountainRenderableSeries and FastBubbleRenderableSeries, as well as other minor enhancements such as including an Annotation Drag event, and a RenderableSeries IsVisibleChanged event.
This feature is still in progress and subject to review, however we have listened to your feedback about the Side-by-side columns / Stacked columns and improved this API to allow more Excel-style charts. More to be announced soon.
This feature is still in progress and subject to review, however we have listened to your feedback and we are developing polar / circular chart types for use in scientific applications. We hope to include this in the coming release.
We are working to integrate our websites (support.scichart.com, www.scichart.com) into one logon, and we plan to integrate the website / support account with your license to give you a better user experience. v3.2 will feature licensing/activation of developer licenses, and your support account will be linked to the developer license. This means, for the first time ever, we will have a system that allows us to give priority to licensed users in our tech-support. It also paves the way for some exciting new business directions, more to be announced…
Not yet! not yet! Some of the features are still in development, however, we are aiming to keep our release cycles short and get this out to you sooner rather than later. As always quality control comes first. If a feature doesn’t meet our standards, it won’t be included, or, the release will be delayed. We will aim to keep you informed either way.
Best regards
[SciChart HQ]
Related Posts
![]()
Queens Award for Innovation
Proud winners of the Queens Award for Innovation, 2019. Awarded on account of our innovative graphics engine which underpins the SciChart library and enables our world-beating charting performance
![]()
National Business Awards
Highly Commended for Lloyds National Business Awards, 2019. Awarded on account of our innovative graphics engine and impressive customer base

Reviews
SciChart has received hundreds of verified, 3rd party reviews
Start a trial and discover why we are the choice
of demanding developers worldwide