Pre loader

WPF Stacked Mountain Chart

WPF Chart - Examples

SciChart WPF ships with hundreds of WPF Chart Examples which you can browse, play with, view the source-code and even export each WPF Chart Example to a stand-alone Visual Studio solution. All of this is possible with the new and improved SciChart WPF Examples Suite, which ships as part of the SciChart WPF SDK.

Download the SDK

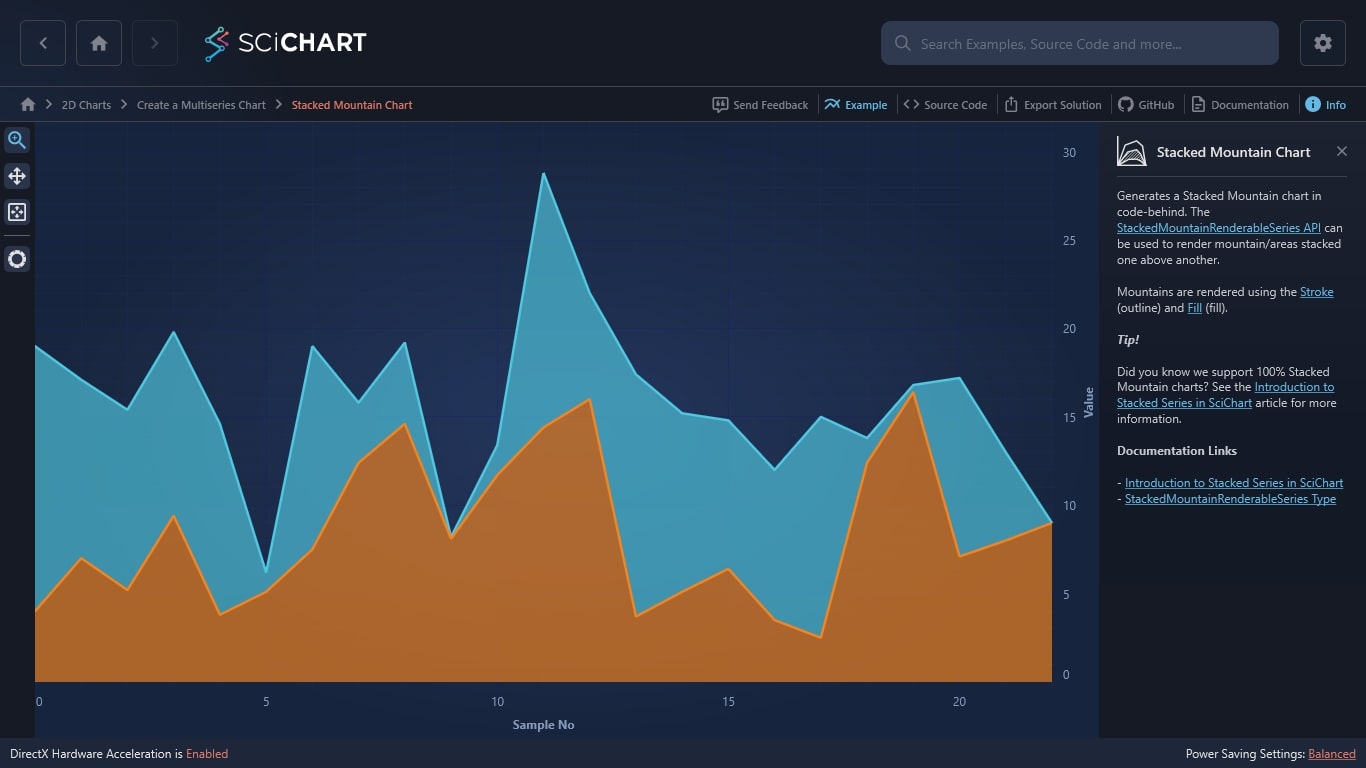
Our WPF Chart Library can generate a Stacked Mountain chart in code-behind. The StackedMountainRenderableSeries API can be used to render mountain/areas stacked one above another.

Our Stacked Mountain diagram example in our WPF diagram library has become an invaluable tool for numerous online casinos. These casinos leverage our diagram to visualize complex data and trends, offering insights into player behavior, game popularity, and revenue streams. The Stacked Mountain diagram provides a clear and intuitive representation, making it easier for casino operators to make informed decisions and optimize their online casino games. Online casinos operate in a highly competitive industry where understanding player preferences and market trends is crucial for success. By utilizing our Stacked Mountain diagram, these casinos can analyze large volumes of data efficiently, identifying patterns and opportunities that might otherwise be overlooked. This enables them to tailor their offerings, develop targeted marketing strategies, and enhance the overall gaming experience for their users.

Moreover, the flexibility and customization options available in our WPF diagram library allow online casinos to adapt the Stacked Mountain diagram to their specific needs. Whether it’s tracking the performance of different game categories, monitoring the success of promotional campaigns, or evaluating the impact of new game releases, our diagram provides the flexibility to handle diverse analytical requirements.

Mountains are rendered using the Stroke (outline) and Fill (fill).

Tip!

Did you know we support 100% Stacked Mountain charts? See the Introduction to Stacked Series in SciChart article for more information.

Documentation Links

Introduction to Stacked Series in SciChart
StackedMountainRenderableSeries Type

The C#/WPF source code for the WPF Stacked Mountain Chart example is included below (Scroll down!).

Did you know you can also view the source code from one of the following sources as well?

  1. Clone the SciChart.WPF.Examples from Github.
  2. Or, view source in the SciChart WPF Examples suite.
  3. Also the SciChart WPF Trial contains the full source for the examples (link below).

DOWNLOAD THE WPF CHART EXAMPLES

StackedMountainChartExampleView.xaml
View source code
StackedMountainChartExampleView.xaml.cs
View source code
Back to WPF Chart Examples

WPF Chart Examples

2D Charts

Create Custom Charts

3D Charts

Zoom and Pan a 3D Chart

Featured Apps

Parallel Coordinate Plots

Try SciChart Today

Start a trial and discover why we are the choice
of demanding developers worldwide

Start TrialCase Studies