WPF Chart - Examples
SciChart WPF ships with hundreds of WPF Chart Examples which you can browse, play with, view the source-code and even export each WPF Chart Example to a stand-alone Visual Studio solution. All of this is possible with the new and improved SciChart WPF Examples Suite, which ships as part of the SciChart WPF SDK.
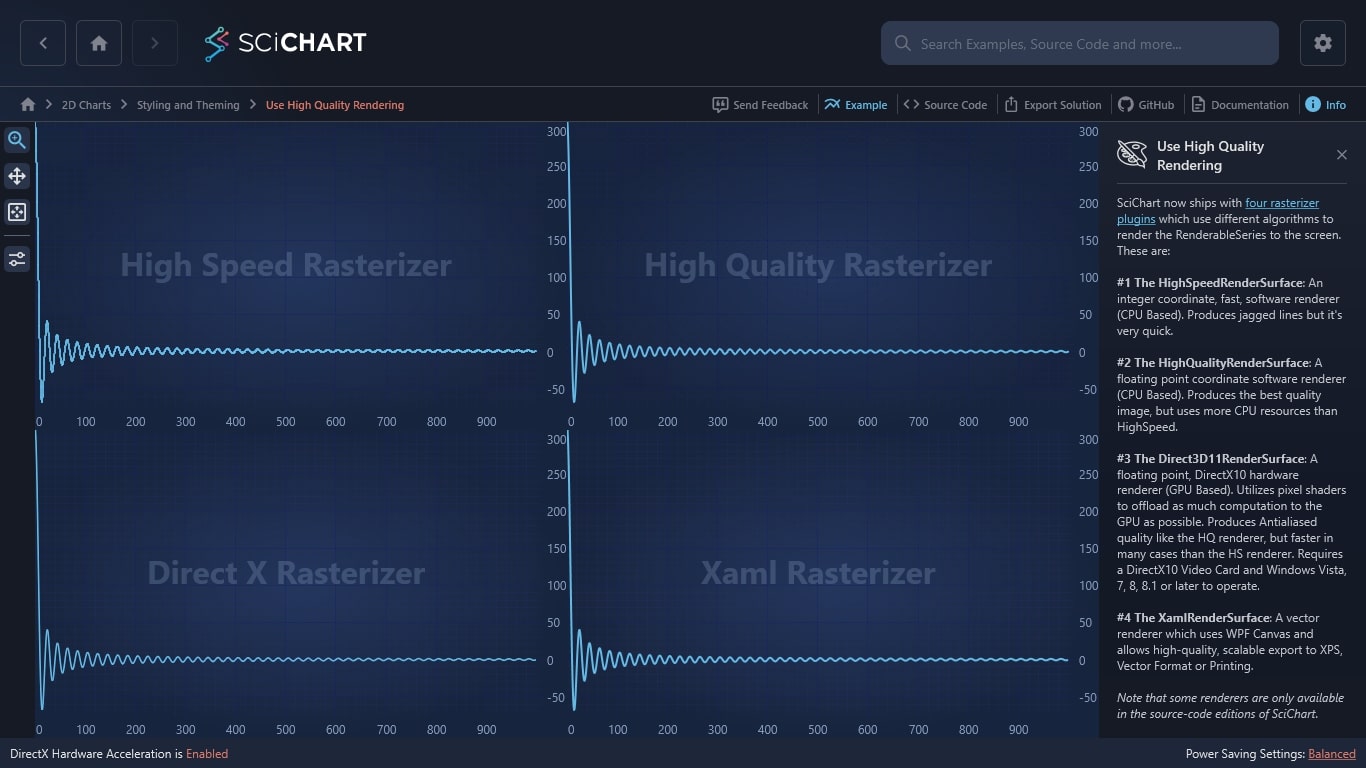
SciChart now ships with four rasterizer plugins which use different algorithms to render the RenderableSeries to the screen. These are:
#1 The HighSpeedRenderSurface: An integer coordinate, fast, software renderer (CPU Based). Produces jagged lines but it’s very quick.
#2 The HighQualityRenderSurface: A floating point coordinate software renderer (CPU Based). Produces the best quality image, but uses more CPU resources than HighSpeed.
#3 The Direct3D11RenderSurface: A floating point, DirectX10 hardware renderer (GPU Based). Utilizes pixel shaders to offload as much computation to the GPU as possible. Produces Antialiased quality like the HQ renderer, but faster in many cases than the HS renderer. Requires a DirectX10 Video Card and Windows Vista, 7, 8, 8.1 or later to operate.
#4 The XamlRenderSurface: A vector renderer which uses WPF Canvas and allows high-quality, scalable export to XPS, Vector Format or Printing.
Note that some renderers are only available in the source-code editions of SciChart.
Documentation Links
– SciChart Renderer Plugins
– Enabling the Visual Xccelerator Rendering Engine
– How Fast is SciChart’s WPF Chart? DirectX vs. Software Comparison

The C#/WPF source code for the WPF Chart Change Renderer Plugin example is included below (Scroll down!).
Did you know you can also view the source code from one of the following sources as well?
- Clone the SciChart.WPF.Examples from Github.
- Or, view source in the SciChart WPF Examples suite.
- Also the SciChart WPF Trial contains the full source for the examples (link below).
