Android Chart - Examples
SciChart Android ships with ~90 Android Chart Examples which you can browse, play with, view the source-code and even export each SciChart Android Chart Example to a stand-alone Android Studio project. All of this is possible with the new and improved SciChart Android Examples Suite, which ships as part of our Android Charts SDK.
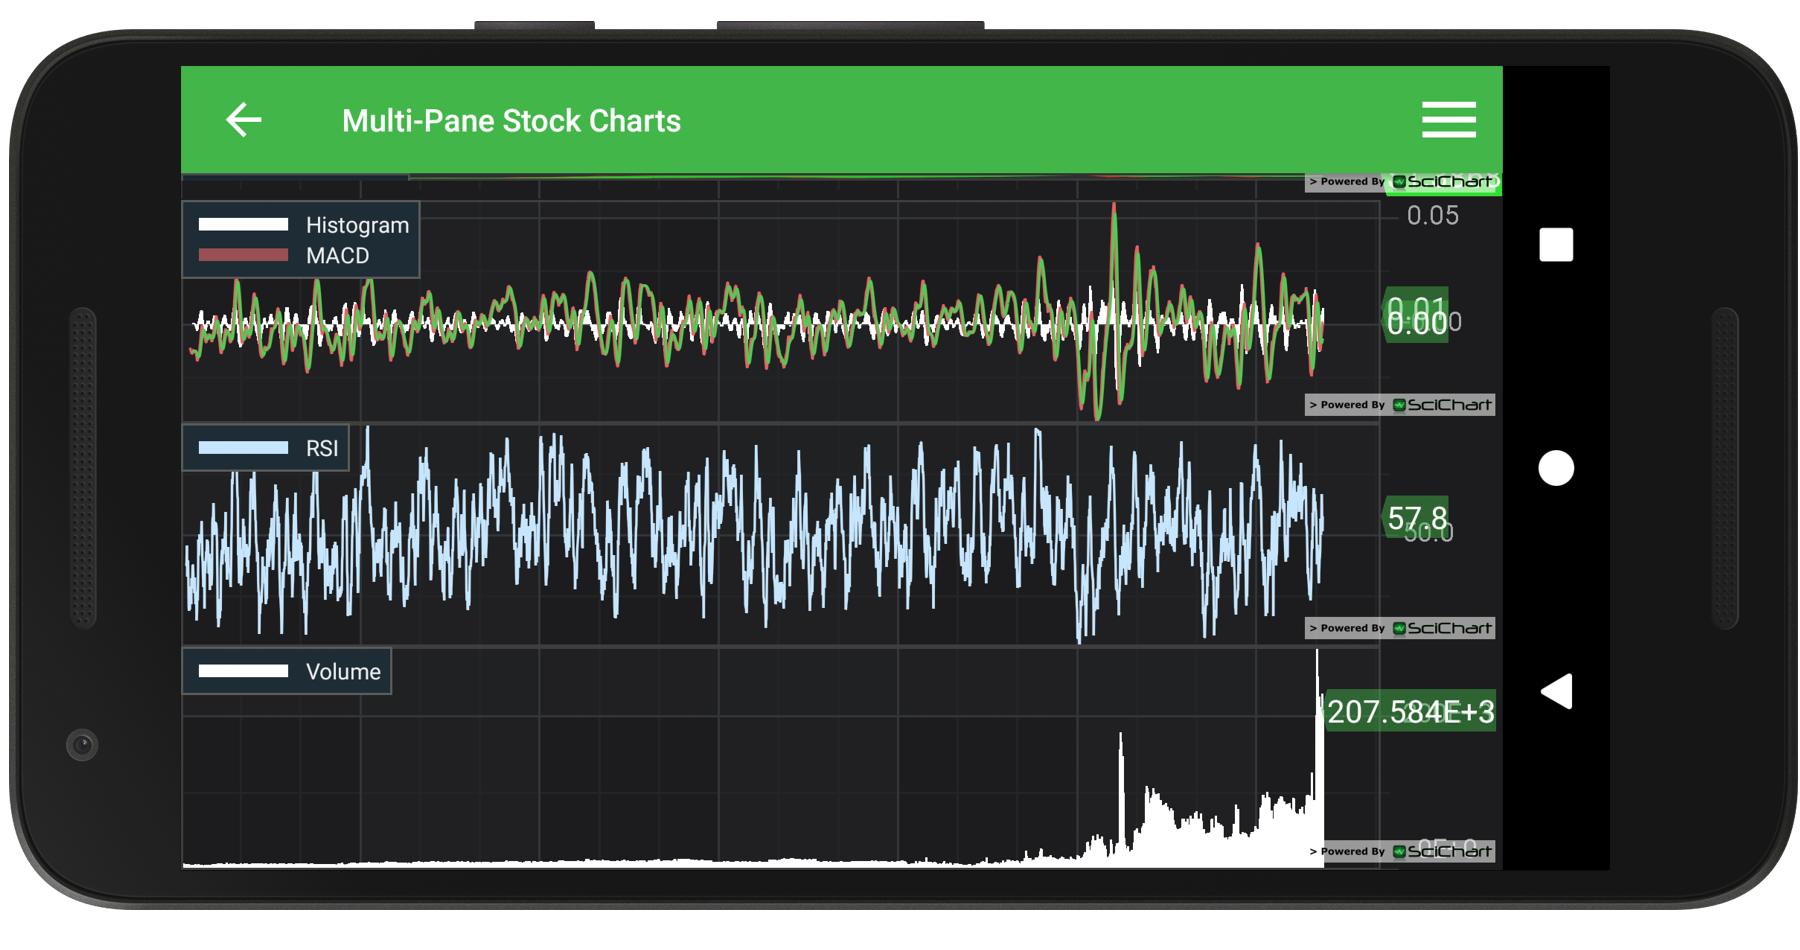
The Multi-Pane Stock Charts example demonstrates creating a static multi-panel stock chart with Volume and Indicator panes. All charts are synchronized by setting the same VisibleRange for their XAxes. The sizes of all X Axes are synchronized using the SciChartVerticalGroup helper class.
Example Usage
– The main(Price) chart can be scrolled dragging its X Axis. All the other charts are synchronized with it, so they will be scrolled too.
– Zoom to the data extents, double-tapping on any chart. The others will be zoomed to the data extents as well.
– Hover to see XY cursor values from all the charts
The full source code for the Android Multi Pane Stock Charts example is included below (Scroll down!).
Did you know you can also view the source code from one of the following sources as well?
- Clone the SciChart.Android.Examples from Github.
- Or, view source and export each example to an Android Studio project from the Java version of the SciChart Android Examples app.
- Also the SciChart Android Trial contains the full source for the examples (link below).


