Getting Started with SCICHART JavaScript Charts
Quickest of the Quick Start Guides Ok so you want to start a SciChart.js JavaScript Chart Trial? Great! Now What? […]
This page is out of date. Please visit the latest documentation.
The following is a brief technical background to creating real-time wpf charts using SCICHART. If you want to go straight to the tutorial, scroll down to Creating the SCICHART Project.
The UML diagram below represents the classes we will interact with in this article. A single chart pane is created by SciChartSurface. This in turn binds to a DataSeriesSet which contains 0..N DataSeries. The SciChartSurface also has a RenderableSeries property which may contain 0..N IRenderableSeries.

SCICHART determines how to render the data by the mapping of RenderableSeries to DataSeries. The mapping is 1:1 and the index of each RenderableSeries maps to the same index of DataSeries. If you want to disable a series (do not render), simply set IRenderableSeries .IsEnabled to false, for instance:

SCICHART employs on-demand rendering and optionally allows multi-threaded data-appending to DataSeries. What this means is, data can be appended to a DataSeries as fast as necessary and on a background thread if desired, while the chart will only draw changes when they are available and when the UI thread is free.

SCICHART doesn’t render continuously, but only when a change in the data has occurred, thus making more efficient use of the CPU. SCICHART also listens to property changes on the chart itself, so updating the color of a series, or the VisibleRange of an axis will also trigger a redraw.
This concept is nothing new, and has been used in computer games to create a game-loop where rendering and processing are performed on different threads.
First up, if you haven’t done so already, you’ll have to register to download the SCICHART Executables.
Next, create a new WPF Application in Visual Studio 2010. SCICHART targets .NET4.0 or Silverlight 5 as a minimum so ensure the framework version is 4.0.
SCICHART supports MVVM however this example will be completed with simple code-behind. We still need to define the chart surface in xaml, so start off with the following markup in your main window:
[xml]
<!– Define the SciChartSurface –>
<SciChart:SciChartSurface x:Name=”sciChartSurface” Margin=”10,10,10,5″ GridLinesPanelStyle=”{StaticResource GridLinesPanelStyle}”>
<!– Create an X Axis –>
<SciChart:SciChartSurface.XAxis>
<SciChart:NumericAxis Style=”{StaticResource NumericAxisStyle}” AxisTitle=”Time (Sec)” MinHeight=”50″/>
</SciChart:SciChartSurface.XAxis>
<!– Create a Y Axis –>
<SciChart:SciChartSurface.YAxis>
<SciChart:NumericAxis Style=”{StaticResource NumericAxisStyle}” AxisTitle=”Value”/>
</SciChart:SciChartSurface.YAxis>
</SciChart:SciChartSurface>
[/xml]
This defines a SciChartSurface with an X and Y axis for numeric values. SCICHART also supports DateTimeAxis however Numeric will cover any numeric type, such as int, long, double.
The styles for GridLinesPanel is defined as follows. Here we just set a background, margin and border for the chart panel.
[xml]
<!– Style for GridLinesPanel (chart pane) –>
<Style x:Key=”GridLinesPanelStyle” TargetType=”SciChart:GridLinesPanel”>
<Setter Property=”BorderBrush” Value=”#FF888888″/>
<Setter Property=”BorderThickness” Value=”1″/>
</Style>
[/xml]
The Numeric Axis can also be styled as follows.
[xml]
<!– Style for NumericAxis –>
<Style x:Key=”NumericAxisStyle” TargetType=”SciChart:AxisBase”>
<Setter Property=”TickTextBrush” Value=”#333″/>
<Setter Property=”DrawMinorGridLines” Value=”False”/>
<Setter Property=”DrawMinorTicks” Value=”False”/>
<Setter Property=”TextFormatting” Value=”0.0″/>
<Setter Property=”AutoRange” Value=”True”/>
<Setter Property=”MajorGridLineStyle”>
<Setter.Value>
<Style TargetType=”Line”>
<Setter Property=”Stroke” Value=”#FF888888″/>
</Style>
</Setter.Value>
</Setter>
<Setter Property=”MajorTickLineStyle”>
<Setter.Value>
<Style TargetType=”Line”>
<Setter Property=”Stroke” Value=”#FF888888″/>
<!– X2, Y2 define the depth of the tick –>
<Setter Property=”X2″ Value=”4″/>
<Setter Property=”Y2″ Value=”4″/>
</Style>
</Setter.Value>
</Setter>
</Style>
[/xml]
The MajorGridLineStyle, MajorTickLineStyle properties allow styles to be applied to the major grid and tick lines. AxisBase also supports MinorGridLineStyle, MinorTickLineStyle, however these are not set as we opt to hide the minor lines in this example.
The TickTextBrush defines a brush for the axis text. AutoRange defines whether the axis should scale to fit the data.
If AutoRange is true, you will not be able to apply interactivity ChartModifiers (e.g. ZoomPanModifier, RubberBandXyZoomModifier) or programmatically set the VisibleRange of the axis, however simply setting AutoRange to false enables these features.
As previously mentioned, SCICHART has the concept of data and renderable series. To render some data we must define N renderable series via the SciChartSurface.RenderableSeries property (type ObservableCollection<IRenderableSeries>).The following example defines three line series and sets them on the SciChartSurface.
[xml]
<!– Define the SciChartSurface –>
<SciChart:SciChartSurface x:Name=”sciChartSurface” Margin=”10,10,10,5″ GridLinesPanelStyle=”{StaticResource GridLinesPanelStyle}”>
<!– Create three RenderableSeries, which map 1:1 to the DataSeries created in code-behind –>
<SciChart:SciChartSurface.RenderableSeries>
<SciChart:FastLineRenderableSeries AntiAliasing=”True” SeriesColor=”#FFE13219″/>
<SciChart:FastLineRenderableSeries AntiAliasing=”True” SeriesColor=”#FFFFA500″/>
<SciChart:FastLineRenderableSeries AntiAliasing=”True” SeriesColor=”#FF4083B7″/>
</SciChart:SciChartSurface.RenderableSeries>
</SciChart:SciChartSurface>
[/xml]
There are several properties which can be set on FastLineRenderableSeries to affect the rendering, coloring and performance. The properties for a line series include SeriesColor, AntiAliasing and ResamplingMode.
The primary series color is styled using SeriesColor property. It should be noted this is not a Brush, but type System.Windows.Media.Color.
The AntiAliasing property can be turned on or off. There is a noticeable performance improvement for very large datasets (>100k points) at the expense of visual acuity from drawing lines without antialiasing. In this example we will leave AntiAliasing on.
The ResamplingMode is used to define how SCICHART resamples series before rendering. Valid values are None, MinMax, Mid, Max, Min.
Creating a DataSeriesSet to fill the SciChartSurface is simple. Just declare a new DataSeriesSet with the desired typeparams. The data is strongly typed and from now on, only double-precision values can be appended.
In our example we will be creating the DataSeriesSet plus three DataSeries to map to the three renderable series previously created as follows:
[csharp]
private void CreateDataSetAndSeries()
{
dataset = new DataSeriesSet();
// DataSeriesSet supports either FIFO or standard series
// we let the user choose which one via the isFifoCheckBox on the toolbar
if (isFifoCheckBox.IsChecked == true)
{
// FifoSize is the size of the circular buffer before old data is discarded
dataset.AddFifoSeries(FifoSize);
dataset.AddFifoSeries(FifoSize);
dataset.AddFifoSeries(FifoSize);
}
else
{
dataset.AddSeries();
dataset.AddSeries();
dataset.AddSeries();
}
sciChartSurface.DataSet = dataset;
}
[/csharp]
Data is appended to the DataSeries by calling DataSeries.Append(x, y), where x and y are individual values, or a collection of values. Internally SCICHART listens to events as data is appended and triggers a redraw. Redrawing occurs on-demand, as soon as the UI thread is free. There is not necessarily a 1:1 relationship between appends and redraws, but rather SCICHART will draw as soon as the UI thread is free.
[csharp]
private void OnNewData(object sender, EventArgs e)
{
// Compute our three series values
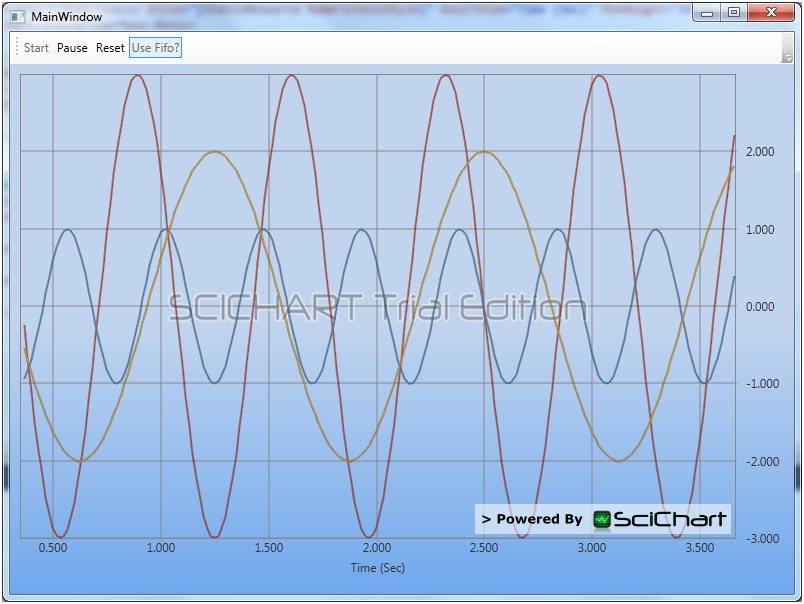
double y1 = 3.0 * Math.Sin(((2 * Math.PI) * 1.4) * t);
double y2 = 2.0 * Math.Cos(((2 * Math.PI) * 0.8) * t);
double y3 = 1.0 * Math.Sin(((2 * Math.PI) * 2.2) * t);
// Suspending updates is optional, and ensures we only get one redraw
// once all three dataseries have been appended to
using (sciChartSurface.SuspendUpdates())
{
// Get the series we previously created
var series1 = dataset[0];
var series2 = dataset[1];
var sSeries3 = dataset[2];
// Append x,y data
series1.Append(t, y1);
series2.Append(t, y2);
series3.Append(t, y3);
}
// Increment current time
t += dt;
}
[/csharp]
The code above appends the data to SCICHART. Firstly by wrapping multiple updates in a sciChart.SuspendUpdates() call we ensure only one redraw at the end. Data values are generating sample by sample using the sinewave equation. All three series are appended simultaneously by calling DataSeries.Append(x, y).
Putting it all together we add a Timer to our code-behind file to tick every 16ms (60Hz). The timer tick executes the code above. We will use the DispatcherTimer which ticks on the UI thread, however it is also possible to use a System.Timers.Timer which ticks on a background thread for higher performance. This is fine, as the DataSeriesSet is thread-safe, and allows multi-threaded access for the highest possible performance.
Running the example you should see something like the following:
View the Example Online
The example can now be viewed online in the Examples Suite – Realtime FIFO Chart Demo
Related Posts
![]()
Queens Award for Innovation
Proud winners of the Queens Award for Innovation, 2019. Awarded on account of our innovative graphics engine which underpins the SciChart library and enables our world-beating charting performance
![]()
National Business Awards
Highly Commended for Lloyds National Business Awards, 2019. Awarded on account of our innovative graphics engine and impressive customer base

Reviews
SciChart has received hundreds of verified, 3rd party reviews
Start a trial and discover why we are the choice
of demanding developers worldwide