Data Visualization for Epilepsy Research Kit for Kids
Mirror HR application, a grand prize winner for the Microsoft annual Global Hackathon 2019.
Roberto and Francesca are Mario’s parents. Mario suffers from seizures since he was 3 years old. Because seizure can happen at any time and can be life-threatening, Mario’s parents would take turns in co-sleeping duties. They needed a way to monitor his state at all times. This is how the concept of the MirrorHR application was born. Together with his colleagues and supported by the FightTheStroke organization Roberto has created a proof of concept for MirrorHR application and won the Microsoft Hackathon in 2019 for it. Mario is already testing the MirroHR.
MirrorHR Application
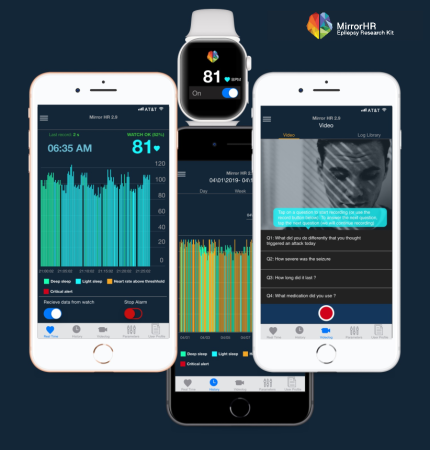
There are two large parts of the application that require data visualization.
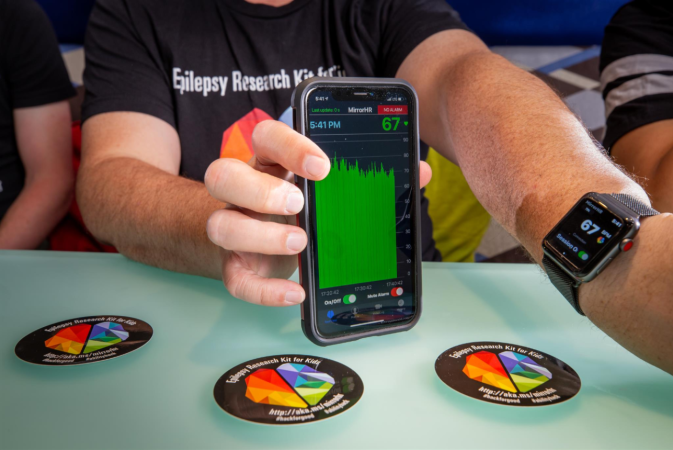
Remote realtime monitoring:
There is a wearable device that reads the biometric data from sensors and then sends it over Wi-Fi or Bluetooth to the MirrorHR app. When the anomalous activity happens, like the spike in a heart rate it alerts the parents or the caregivers about the possible seizure.
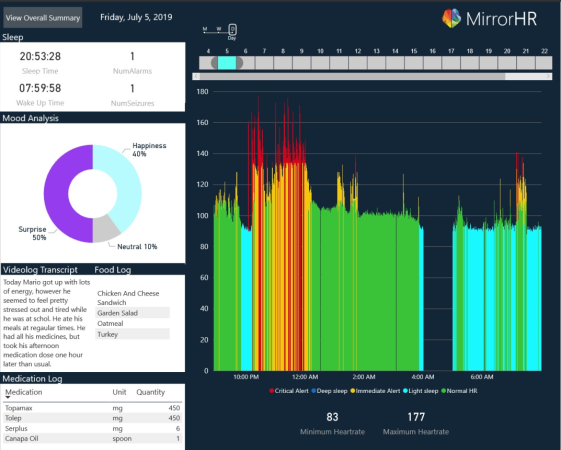
The history view:
The data is recoded and allows to go back to weekly and in the future monthly history view. The AI will be used here to learn from data patterns and get more information about the triggers of the seizures.
Visualization of Data Requirements
SciChart was chosen to be a data visualization tool for MirrorHR app.
- The live monitoring requires from 1 data sent every 4 seconds up to 20 data points per second, depending on the device.
- It has to be recorded for at least 9 to 10 hours, in total displaying of 9,000 to 720,000 datapoints.
- The historical view of weekly data would require displaying from 150,000 data points up to 12,000,000.
SciChart was chosen for Data Visualization
- It was the only software in the world able to handle the required capacity of data;
- Its flexibility allowed to extensible customizations, like the recorded data recoded to be colored in a specific color.
- Its API is very easy to use in Swift UI.
Parents like us they go through a trauma process. Realtime charts are a way to take back a bit of control in a stress scenario. Trusting what I see on the application I can check if everything is ok without waking up my kid. Value is not what people expect it to be. For me it was to be able to get some sleep again without constantly hovering over my son, checking what is going on.
Roberto D’Angelo -Lead of MirrorHR project,
Enjoyed our case studies? Have any questions? You can download a PDF version and share it with your colleagues. Think you know someone who might benefit from the MirrorHR application – visit the mirrorhr.org website.
Want to learn more about SciChart capabilities, contact us! Better download a trial and see yourself what you can do with SciChart. Our team expertise is not just limited to SciChart, charts, and graphics & drawing. Hire us for Expert Consultancy Projects or Expert One to One Support!
