SciChart WPF v8.3 Released!
We’ve moved over to a new format for communicating our releases and updates of our popular WPF Charts library, by publishing […]
This page is out of date. To see the latest guide, please go to the updated documentation
An often requested demonstration is how to add and remove annotations on a SciChartSurface using the MVVM pattern. MVVM is a great way to split your code into View (user interface) and business logic, to create decoupled, testable and maintainable applications.
It’s easy to forget sometimes the purpose of MVVM (or any pattern) is to simplify software development and decouple modules, making for more maintainable software, when sometimes we do exactly the opposite in order to meet a rule! This article will demonstrate a way we can bind annotations to viewmodels without compromising MVVM, or introducing any nasty hacks just to make it happen.
So here it is! Let’s get started. You will need to download and install SciChart v1.5.x for this.
First lets start by creating a Visual Studio solution. Here at SciChart we use VS2012, however VS2010 is also supported.
Create a new WPF project in your chosen IDE and add a reference to SciChart WPF. You can find the libraries under C:/Program Files (x86)/ABT Software Services/SciChart/Lib/

Now with the solution created, add a SciChartSurface to the MainWindow.xaml. It should build at this point. If not, double check your references, the target .NET framework and xmlns namespace declarations.

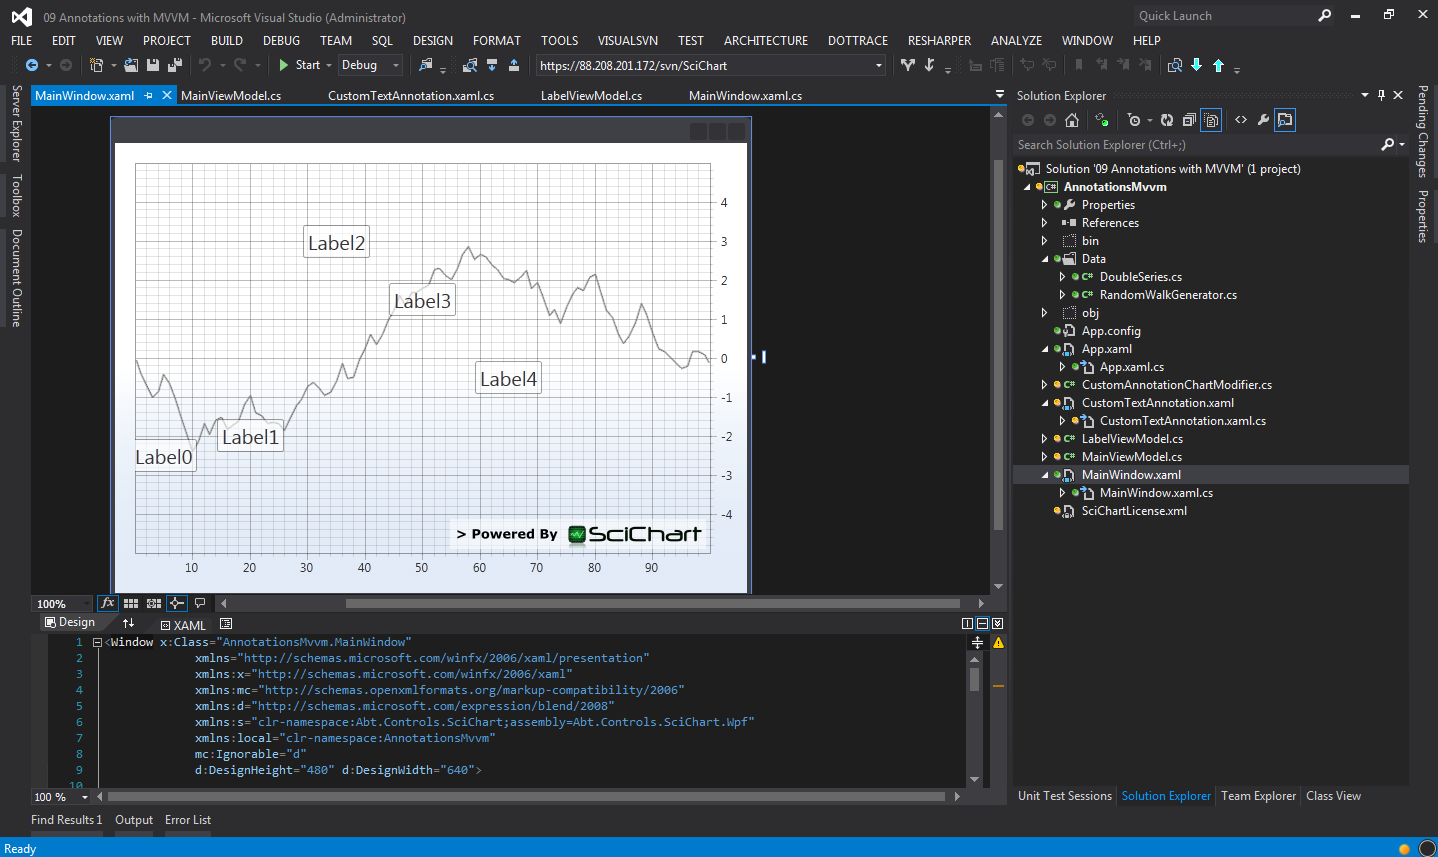
Now lets add some Axes to the chart. We will assign a VisibleRange and GrowBy properties, plus assign a theme to cause the chart to paint itself in the designer.
<Window x:Class="AnnotationsMvvm.MainWindow"

             xmlns:x="http://schemas.microsoft.com/winfx/2006/xaml"
             xmlns:mc="http://schemas.openxmlformats.org/markup-compatibility/2006"
             xmlns:d="http://schemas.microsoft.com/expression/blend/2008"
             xmlns:s="clr-namespace:Abt.Controls.SciChart;assembly=Abt.Controls.SciChart.Wpf"
             xmlns:local="clr-namespace:AnnotationsMvvm"
             mc:Ignorable="d"
             d:DesignHeight="480" d:DesignWidth="640">

    <Grid>

      <!-- Note, we're using the new MVVM SeriesSource API in v1.5 -->
      <s:SciChartSurface SeriesSource="{Binding ChartSeries}" s:ThemeManager.Theme="Chrome">

        <s:SciChartSurface.XAxis>
          <s:NumericAxis VisibleRange="0,100"/>
        </s:SciChartSurface.XAxis>

        <s:SciChartSurface.YAxis>
          <s:NumericAxis VisibleRange="-5,5"/>
        </s:SciChartSurface.YAxis>

      </s:SciChartSurface>
    </Grid>
</Window>
You should now be looking at something a little like this:

The MainViewModel is going to be the controller / data-provider for the MainWindow in this example. It is going to provide chart data, series colors and data-objects for the annotations.
Here’s the code for the MainViewModel in entirety. In a moment we will walk through the code to explain it.
namespace AnnotationsMvvm
{
    public class MainViewModel : INotifyPropertyChanged
    {
        private ObservableCollection<IChartSeriesViewModel> _chartSeries;
        private IEnumerable<LabelViewModel> _chartLabels;

        // I'll leave it to you to wire up PropertyChanged to your base viewmodel type
        public event PropertyChangedEventHandler PropertyChanged;

        public MainViewModel()
        {
            var ds0 = new XyDataSeries<double, double>();

            // RandomWalkGenerator is found in the examples source code
            var someData = new RandomWalkGenerator().GetRandomWalkSeries(100);

            ds0.Append(someData.XData, someData.YData);

            // With SeriesSource API you do not need a DataSet. This is created automatically to match
            // the type of DataSeries<Tx,Ty>. All DataSeries must be the same type however

            // Create a list of ChartSeriesViewModel which unify dataseries and render series
            // This way you can add/remove your series and change the render series type easily
            // without worrying about DataSeriesIndex as per SciChart v1.3
            _chartSeries = new ObservableCollection<IChartSeriesViewModel>();
            _chartSeries.Add(new ChartSeriesViewModel(ds0, new FastLineRenderableSeries()));

            // Now create the labels
            _chartLabels = new[]
                               {
                                   new LabelViewModel(5, -2.5, "Label0", "Label0 Tooltip!"),
                                   new LabelViewModel(20, -2, "Label1", "Label1 Tooltip!"),
                                   new LabelViewModel(35, 3, "Label2", "Label2 Tooltip!"),
                                   new LabelViewModel(50, 1.5, "Label3", "Label3 Tooltip!"),
                                   new LabelViewModel(65, -0.5, "Label4", "Label4 Tooltip!"),
                               };
        }

        public ObservableCollection<IChartSeriesViewModel> ChartSeries { get { return _chartSeries; }}

        public IEnumerable<LabelViewModel> ChartLabels { get { return _chartLabels; } }
    }
}
Breaking this down, what we do is first create an XyDataSeries. This stores X-Y values in an optimized data structure that SciChart can consume. We append a Random Walk (randomly generated time series).
var ds0 = new XyDataSeries<double, double>();

// RandomWalkGenerator is found in the examples source code
var someData = new RandomWalkGenerator().GetRandomWalkSeries(100);

ds0.Append(someData.XData, someData.YData);
You should note the XyDataSeries expects data to be sorted in the X-Direction. This is to enable fast indexing of the data when zooming and panning. If you want to add unsorted data-values then you should check out the UnsortedXyDataSeries.
Also note that the RandomWalkGenerator class can be found in the examples source code contained in the SciChart Trial Installer.
The next part we create a collection of ChartSeriesViewModels. SciChart can bind to these in an MVVM context from the SeriesSource property
// With SeriesSource API you do not need a DataSet. This is created automatically to match
// the type of DataSeries<Tx,Ty>. All DataSeries must be the same type however

// Create a list of ChartSeriesViewModel which unify dataseries and render series
// This way you can add/remove your series and change the render series type easily
// without worrying about DataSeriesIndex as per SciChart v1.3
_chartSeries = new ObservableCollection<IChartSeriesViewModel>();
_chartSeries.Add(new ChartSeriesViewModel(ds0, new FastLineRenderableSeries()));
In the above code we create an ObservableCollection of IChartSeriesViewModel. This is a viewmodel type defined in the SciChart library, which unifies a DataSeries and RenderableSeries. The DataSeries has already been filled with data. I won’t go too much into detail of the SeriesSource API, save to say there are plenty of MVVM demos on our website which show how to use this API.
This next part is interesting. Here we define and expose an ObservableCollection of annotation view models.
// Inside MainViewModel, we now create the labels
_chartLabels = new[]
{
new LabelViewModel(5, -2.5, "Label0", "Label0 Tooltip!"),
new LabelViewModel(20, -2, "Label1", "Label1 Tooltip!"),
new LabelViewModel(35, 3, "Label2", "Label2 Tooltip!"),
new LabelViewModel(50, 1.5, "Label3", "Label3 Tooltip!"),
new LabelViewModel(65, -0.5, "Label4", "Label4 Tooltip!"),
};
// ...
public IEnumerable<LabelViewModel> ChartLabels { get { return _chartLabels; } }
Where is LabelViewModel defined? This is a custom class created for this tutorial. Basically you just need to create a class, ensure it implements INotifyPropertyChanged, and has some properties to define the position and labels. Here is the LabelViewModel class in entirety:
public class LabelViewModel : INotifyPropertyChanged
{
    public event PropertyChangedEventHandler PropertyChanged;

    public LabelViewModel(IComparable x1, IComparable y1, string text, string tooltip)
    {
        X1 = x1;
        Y1 = y1;
        LabelText = text;
        LabelToolTip = tooltip;
    }

    /// <summary>
    /// LabelText will allow us to bind to TextAnnotation.Text
    /// </summary>
    public string LabelText { get; set; }

    /// <summary>
    /// LabelTooltip will be used to add a custom tooltip to the TextAnnotation
    /// </summary>
    public string LabelToolTip { get; set; }

    /// <summary>
    /// X1 defines the X Data-Value for positioning the annotation
    /// </summary>
    public IComparable X1 { get; set; }

    /// <summary>
    /// Y1 defines the Y Data-Value for positioning the annotation
    /// </summary>
    public IComparable Y1 { get; set; }
}Ok, so to run the example and see some data in the chart, we need to ensure an instance of the MainViewModel is set on the chart. Add this XAML to the top of your MainWindow.xaml file.
<Window x:Class="AnnotationsMvvm.MainWindow"

             xmlns:x="http://schemas.microsoft.com/winfx/2006/xaml"
             xmlns:mc="http://schemas.openxmlformats.org/markup-compatibility/2006"
             xmlns:d="http://schemas.microsoft.com/expression/blend/2008"
             xmlns:s="clr-namespace:Abt.Controls.SciChart;assembly=Abt.Controls.SciChart.Wpf"
             xmlns:local="clr-namespace:AnnotationsMvvm"
             mc:Ignorable="d"
             d:DesignHeight="480" d:DesignWidth="640">

    <Window.Resources>
        <local:MainViewModel x:Key="viewModel"/>
    </Window.Resources>

    <Grid DataContext="{StaticResource viewModel}">

      <s:SciChartSurface SeriesSource="{Binding ChartSeries}"
              <!-- Omitted for brevity ... -->
      </s:SciChartSurface>
    </Grid>
</Window>
Now, if you run the application so far, you should see something like this:
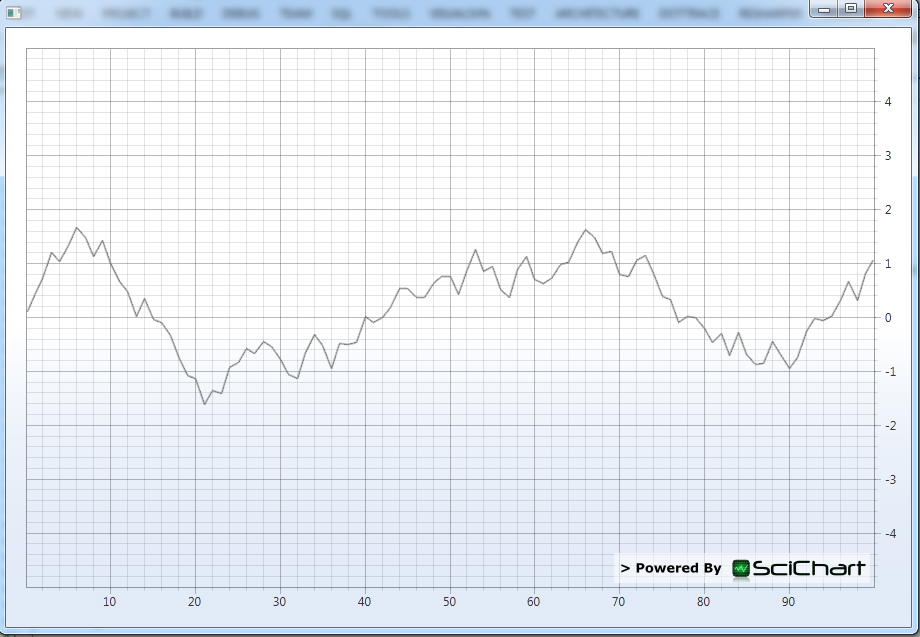

You should even see the data in the designer, because the ViewModel bindings are evaluated at design time. Isn’t that neat!?
Don’t see it? Here are some tips to debug why the chart is not showing:
If you recall we instantiated a collection of LabelViewModels in the MainViewModel. We need to bind to these and add them to the chart. To do this we can create a custom ChartModifier.
SciChart exposes a rich API for interacting with the chart data or visible ranges. By inheriting from ChartModifierBase, you can access API functions for manipulating range, responding to mouse events etc…
Let’s get started. Create a class which inherits ChartModifierBase. We are going to add a DependnecyProperty called LabelsSource, of type IEnumerable. We will later bind this directly to the MainViewModel.Labels property
public class CustomAnnotationChartModifier : ChartModifierBase
{
    public static readonly DependencyProperty LabelsSourceProperty = DependencyProperty.Register("LabelsSource", typeof(IEnumerable), typeof(CustomAnnotationChartModifier), new PropertyMetadata(null, OnLabelsSourceChanged));

    // Here LabelsSource is IEnumerable, but you could easily make it
    // ObservableCollection<LabelViewModel>
    // in order to get changed notifications when items are added to, or removed from the collection
    public IEnumerable LabelsSource
    {
        get { return (IEnumerable) GetValue(LabelsSourceProperty); }
        set { SetValue(LabelsSourceProperty, value); }
    }

    // Get a notification when new labels are set.
    private static void OnLabelsSourceChanged(DependencyObject d, DependencyPropertyChangedEventArgs e)
    {
        var modifier = (CustomAnnotationChartModifier) d;
        IEnumerable newValue = e.NewValue as IEnumerable;
        if (newValue == null) return;

        modifier.RebuildAnnotations();
    }

    // Recreate all annotations
    private void RebuildAnnotations()
    {
       // Todo
    }

    /// <summary>
    /// Called when the Chart Modifier is attached to the Chart Surface
    /// </summary>
    public override void OnAttached()
    {
        base.OnAttached();

        // Catch the condition where LabelsSource binds before chart is shown. Rebuild annotations
        if (LabelsSource != null && base.ParentSurface.Annotations.Count == 0)
        {
            RebuildAnnotations();
        }
    }
}
Ok so far, this is really simple. Now you can add the CustomAnnotationChartModifier to the ScIChartSurface. You can also use this alongside other chart modifiers, e.g. ZoomPanModifier, RubberBandXyZoomModifier, ZoomExtentsModifier if placed in a modifier group. We’re going to start off by just adding the single modifier and declaring the binding to LabelsSource property in the MainViewModel:
<s:SciChartSurface SeriesSource="{Binding ChartSeries}"

<!-- Omitted for brevity ... -->

<s:SciChartSurface.ChartModifier>
  <local:CustomAnnotationChartModifier LabelsSource="{Binding ChartLabels}"/>
</s:SciChartSurface.ChartModifier>

</s:SciChartSurface>
If you run the app now, you should be able to put a breakpoint in the CustomAnnotationChartModifier.OnLabelsSourceChanged method and step through to see if the binding is wired up correctly.
What next? Lets add and position our annotations. Remember the RebuildAnnotations() method with its //TODO comment? Ok, now lets add this body to the chart.
// Recreate all annotations, called when LabelsSource property changes
// or when the CustomAnnotationChartModifier is attached to the parent surface
private void RebuildAnnotations()
{
    if (base.ParentSurface == null || LabelsSource == null)
        return;

    // Take a look at the base class, ChartModifierBase for a wealth of API
    // methods and properties to manipulate the SciChartSurface
    var annotationCollection = base.ParentSurface.Annotations;
    annotationCollection.Clear();

    foreach(var item in LabelsSource)
    {
        annotationCollection.Add(new CustomTextAnnotation() { DataContext = item });
    }
}
We also need a custom annotation. All this is, is a class that inherits CustomTextAnnotation but has the bindings to LabelText and LabelTooltip. There are other ways to do this, for instance:
Anyway, for simplicity we’re going to create a class which inherits TextAnnotation and define the bindings in there. Here’s the source:
<s:TextAnnotation x:Class="AnnotationsMvvm.CustomTextAnnotation"

             xmlns:x="http://schemas.microsoft.com/winfx/2006/xaml"
             xmlns:mc="http://schemas.openxmlformats.org/markup-compatibility/2006"
             xmlns:d="http://schemas.microsoft.com/expression/blend/2008"
             xmlns:s="clr-namespace:Abt.Controls.SciChart;assembly=Abt.Controls.SciChart.Wpf"
             mc:Ignorable="d"
             d:DesignHeight="300" d:DesignWidth="300"
             Text="{Binding LabelText}"
             Foreground="#333"
             Background="#99FFFFFF"
             BorderBrush="#77333333"
             BorderThickness="1"
             CornerRadius="2"
             VerticalAnchorPoint="Center"
             HorizontalAnchorPoint="Center"
             X1="{Binding X1}"
             Y1="{Binding Y1}">
  <ToolTipService.ToolTip>
    <Grid>
      <TextBlock Text="{Binding LabelToolTip}"/>
    </Grid>
  </ToolTipService.ToolTip>
</s:TextAnnotation>
The important parts are:
Ok, now running the app, you should see something like this
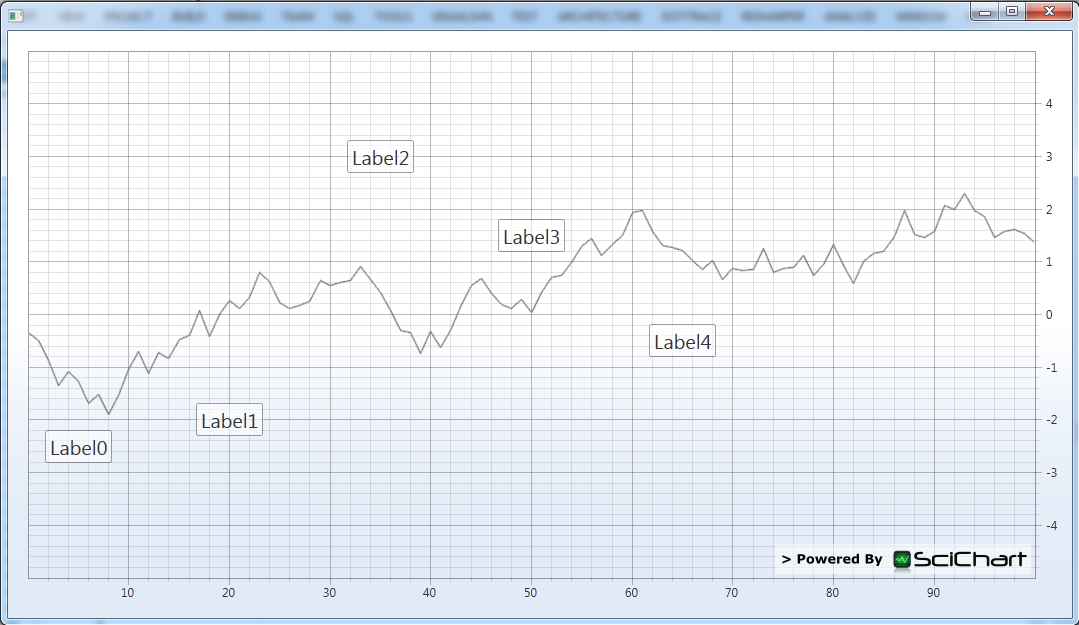
Tah dah!
Finally if you hover the labels you will see they have a tooltip, data-bound to the LabelViewModel.
Again check you don’t have any binding errors in the output window. Are your series rendering? If not you will need to ensure SeriesSource binding is being evaluated properly, that you have bound to a property with DataSeries and RenderableSeries and have declared an X and Y axes of the correct type on the SciChartSurface.
If your labels are not showing, ensure you have created and bound to a LabelViewModel collection by checking for binding errors, and by putting a breakpoint in your CustomAnnotationChartModifier.RebuildAnnotations method. Finally double check you have bound the properties on CustomTextAnnotation to the LabelViewModel properties.
In this example we’ve demonstrated how to bind TextAnnotation position, label and tooltip to ViewModels. So what else can you do?
Well, In this example we data-bind trades (buy, sell) and news bullets on a price chart by binding the ScIChartSurface.Annotations property directly to an AnnotationCollection property in the ViewModel.
You could also data-bind the Y1 value of a HorizontalLineAnnotation to create a dynamic threshold, either editable from the UI or set programmatically from the ViewModel.
Or maybe you want to databind lines, or arrows created by the user (via clicks) in the view-model. In this case you would use the same technique as the Trade Markers example, by binding to AnnotationCollection in the ViewModel, after the user creates annotations you can access the newly created annotation position.
For your convenience, we’ve also included the Annotations With MVVM Tutorial source code here. however note it doens’t have the SciChart binaries, you’ll need to get those off the downloads page.
Thanks and enjoy!
Related Posts
![]()
Queens Award for Innovation
Proud winners of the Queens Award for Innovation, 2019. Awarded on account of our innovative graphics engine which underpins the SciChart library and enables our world-beating charting performance
![]()
National Business Awards
Highly Commended for Lloyds National Business Awards, 2019. Awarded on account of our innovative graphics engine and impressive customer base

Reviews
SciChart has received hundreds of verified, 3rd party reviews
Start a trial and discover why we are the choice
of demanding developers worldwide