Adding SciChartSurface using XML
Open up your activity_main.xml file and add SciChartSurface, like this:
<com.scichart.charting.visuals.SciChartSurface
    android:id="@+id/surface"
    android:layout_width="match_parent"
    android:layout_height="match_parent"/>
Adding Axes to the SciChartSurface
Once you have added a SciChartSurface into your Activity, you will not see anything drawn because you need to add axes. This is an important thing here - two axes X and Y has to be added to your surface. This is a bare minimum to see a drawn grid on your device.
val xAxis: IAxis = NumericAxis(this)
val yAxis: IAxis = NumericAxis(this)

UpdateSuspender.using(surface) {
    surface.xAxes.add(xAxis)
    surface.yAxes.add(yAxis)
}
Adding Renderable Series
Now, we would like to see something more than just an empty grid, e.g. Line Chart. So let's add some RenderableSeries with appropriate DataSeries to our surface:
val count = 1000
val xValues = DoubleValues(count)
val yValues = DoubleValues(count)

for (i in 0 until count) {
    val x = 10.0 * i.toDouble() / count.toDouble()
    val y = sin(2 * x)
    xValues.add(x)
    yValues.add(y)
}

val dataSeries = XyDataSeries(Double::class.javaObjectType, Double::class.javaObjectType).apply {
    append(xValues, yValues)
}

val renderableSeries = FastLineRenderableSeries().apply {
    this.dataSeries = dataSeries
}

surface.renderableSeries.add(renderableSeries)
Note
You might have noticed, that we used DoubleValues while appending points to IXyDataSeries<TX,TY>. That's the recommended way of appending data, due to better performance, comparing to adding points one by one. You can use append(TX[] xValues, TY[] yValues) if you want though.
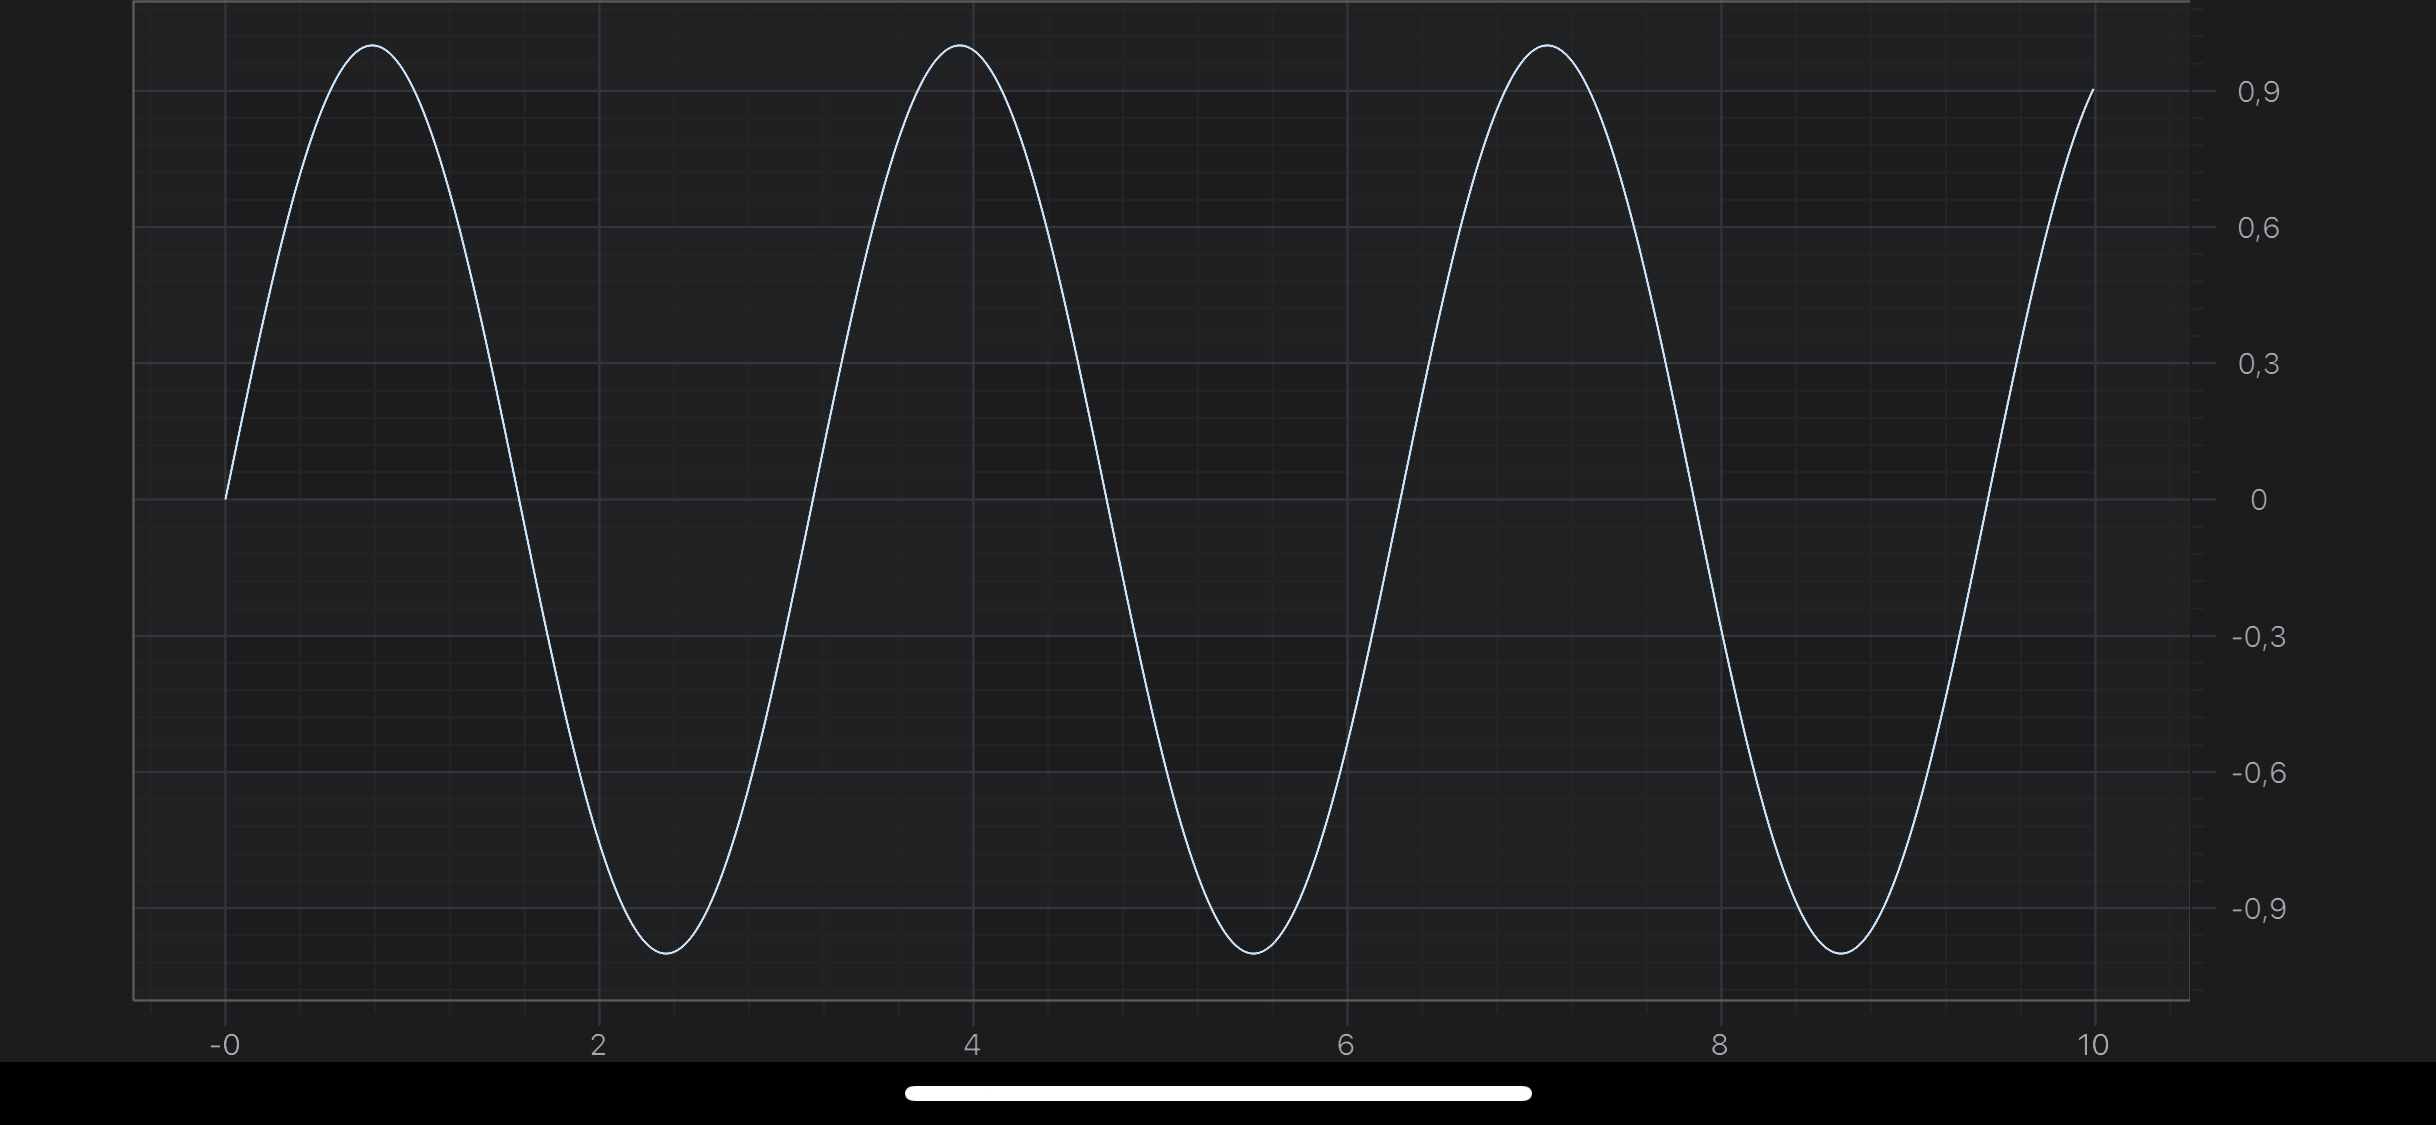
Final example code
So let's see what we've managed to get. Let's see the listing from the MainActivity below:
class MainActivityUsingXml : AppCompatActivity() {

    private lateinit var binding: ActivityMainUsingXmlBinding

    override fun onCreate(savedInstanceState: Bundle?) {
        super.onCreate(savedInstanceState)

        binding = ActivityMainUsingXmlBinding.inflate(layoutInflater)
        setContentView(binding.root)

        val surface = findViewById<SciChartSurface>(R.id.surface)

        val xAxis: IAxis = NumericAxis(this)
        val yAxis: IAxis = NumericAxis(this)

        UpdateSuspender.using(surface) {
            surface.xAxes.add(xAxis)
            surface.yAxes.add(yAxis)
        }

        val count = 1000
        val xValues = DoubleValues(count)
        val yValues = DoubleValues(count)

        for (i in 0 until count) {
            val x = 10.0 * i.toDouble() / count.toDouble()
            val y = sin(2 * x)
            xValues.add(x)
            yValues.add(y)
        }

        val dataSeries = XyDataSeries(Double::class.javaObjectType, Double::class.javaObjectType).apply {
            append(xValues, yValues)
        }

        val renderableSeries = FastLineRenderableSeries().apply {
            this.dataSeries = dataSeries
        }

        surface.renderableSeries.add(renderableSeries)
    }
}
Note
Please note that we've added axes and renderableSeries to SciChartSurface inside using(ISuspendable suspendable, Runnable runnable) block. This allows you to suspend surface instance, and refresh it only one time after you finished all needed operations. That's highly recommended technique if you want to omit performance decrease due to triggering refreshes on every operation which could be performed in one batch.
The SciChartSurface3D Type
The root 3D chart view is called the SciChartSurface3D. This is the Android View which you will be adding to your applications wherever you need a 3D chart. You can add more than one SciChartSurface3D, you can configure them independently and you can link them together.
Since this is a Quick Start Example, we will use the one instance of SciChartSurface3D, so let’s start by declaring one!
Declaring a ChartSurface3D Instance
Declaring SciChartSurface3D to your application is no different than the regular SciChartSurface, so please refer to the corresponding section in this article.
Adding 3D Axes to the SciChartSurface3D
Once you have added a SciChartSurface3D into your Activity, you will not see anything drawn because you need to add axes. This is an important thing here - three axes X, Y, and Z has to be added to your surface. This is a bare minimum to see a drawn grid on your device.
UpdateSuspender.using(surface) {
    surface.xAxis = NumericAxis3D()
    surface.yAxis = NumericAxis3D()
    surface.zAxis = NumericAxis3D()
}
Adding 3D Renderable Series
Now, we would like to see something more than just an empty grid, e.g. Scatter 3D Chart. So let’s add some RenderableSeries3D with appropriate DataSeries 3D to our surface:
val dataSeries = XyzDataSeries3D(Double::class.javaObjectType, Double::class.javaObjectType, Double::class.javaObjectType)

for (i in 0 until 100) {
    val x = 5 * sin(i.toDouble())
    val y = i.toDouble()
    val z = 5 * cos(i.toDouble())
    dataSeries.append(x, y, z)
}

val rSeries = PointLineRenderableSeries3D().apply {
    this.dataSeries = dataSeries
    strokeThickness = 3.0f
}

surface.renderableSeries.add(rSeries)
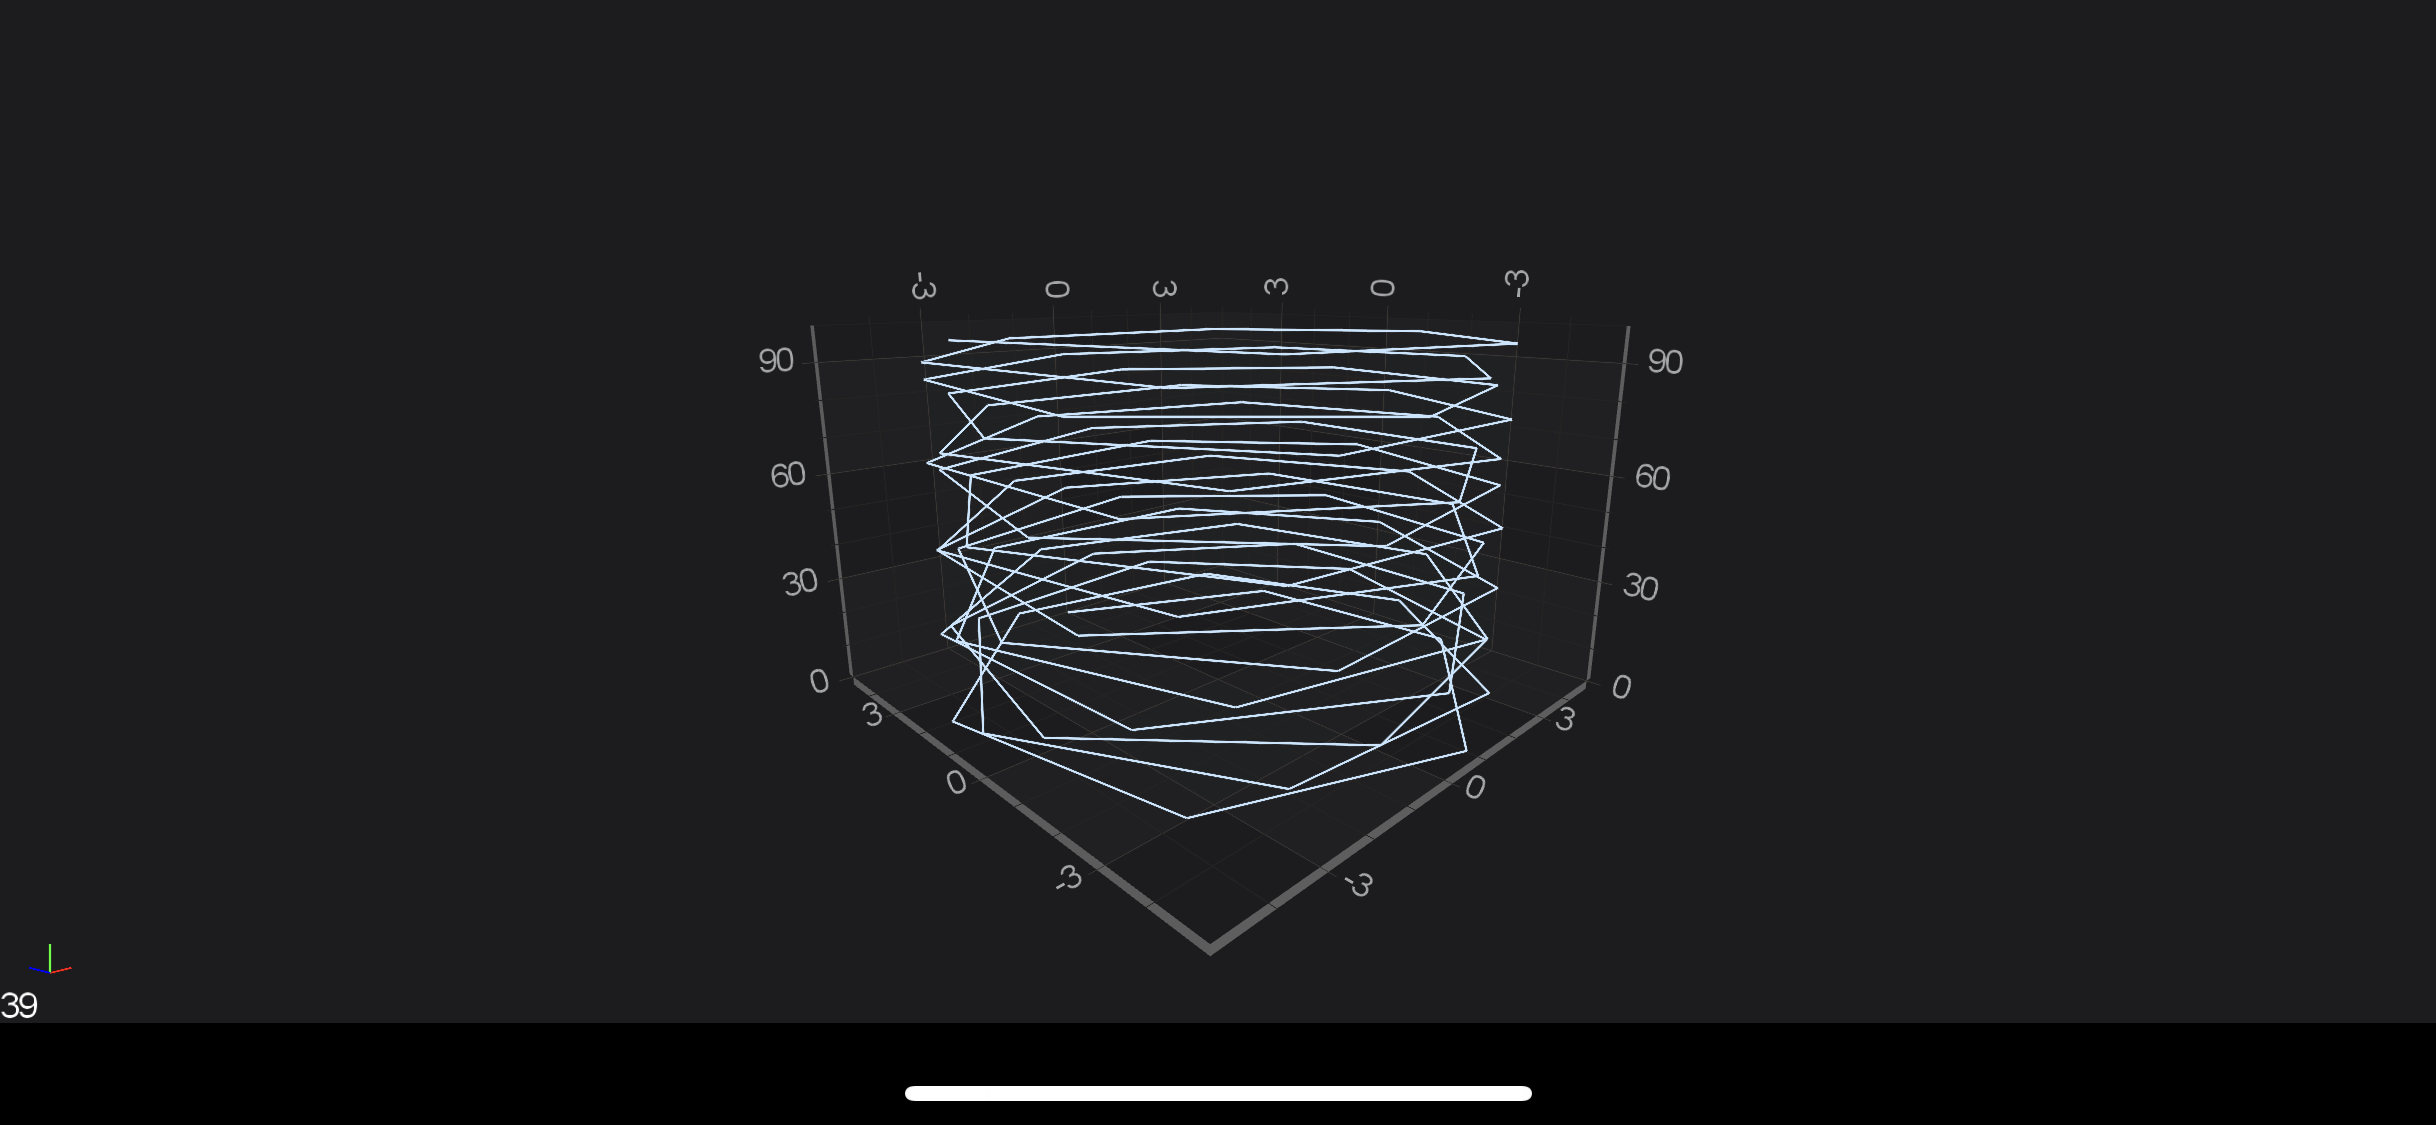
Final example 3D code
So let's see what we've managed to get. Let's see the listing from the Activity below:
class MainActivity : AppCompatActivity() {
    private lateinit var binding: ActivityMainUsingXmlBinding

    override fun onCreate(savedInstanceState: Bundle?) {
        super.onCreate(savedInstanceState)

        binding = ActivityMainUsingXmlBinding.inflate(layoutInflater)
        setContentView(binding.root)

        val surface = findViewById<SciChartSurface3D>(R.id.surface)

        UpdateSuspender.using(surface) {
            surface.xAxis = NumericAxis3D()
            surface.yAxis = NumericAxis3D()
            surface.zAxis = NumericAxis3D()
        }

        val dataSeries = XyzDataSeries3D(Double::class.javaObjectType, Double::class.javaObjectType, Double::class.javaObjectType)

        for (i in 0 until 100) {
            val x = 5 * sin(i.toDouble())
            val y = i.toDouble()
            val z = 5 * cos(i.toDouble())
            dataSeries.append(x, y, z)
        }

        val rSeries = PointLineRenderableSeries3D().apply {
            this.dataSeries = dataSeries
            strokeThickness = 3.0f
        }

        surface.renderableSeries.add(rSeries)
    }
}
Note
Please note that we've added axes and renderableSeries to SciChartSurface3D inside using(ISuspendable suspendable, Runnable runnable) block. This allows you to suspend surface instance, and refresh it only one time after you finished all needed operations. That's highly recommended technique if you want to omit performance decrease due to triggering refreshes on every operation which could be performed in one batch.