Axis Ranging - Get or Set VisibleRange
How to modify VisibleRange for different Axis Types
To programmatically range an axis, set the property setVisibleRange(IRange visibleRange).
Note
The type of object that needs to be applied to the Axis VisibleRange depends on the axis type.
For more information about setting VisibleRange on particular Axis type - please see the following:
Adding Padding or Spacing with GrowBy
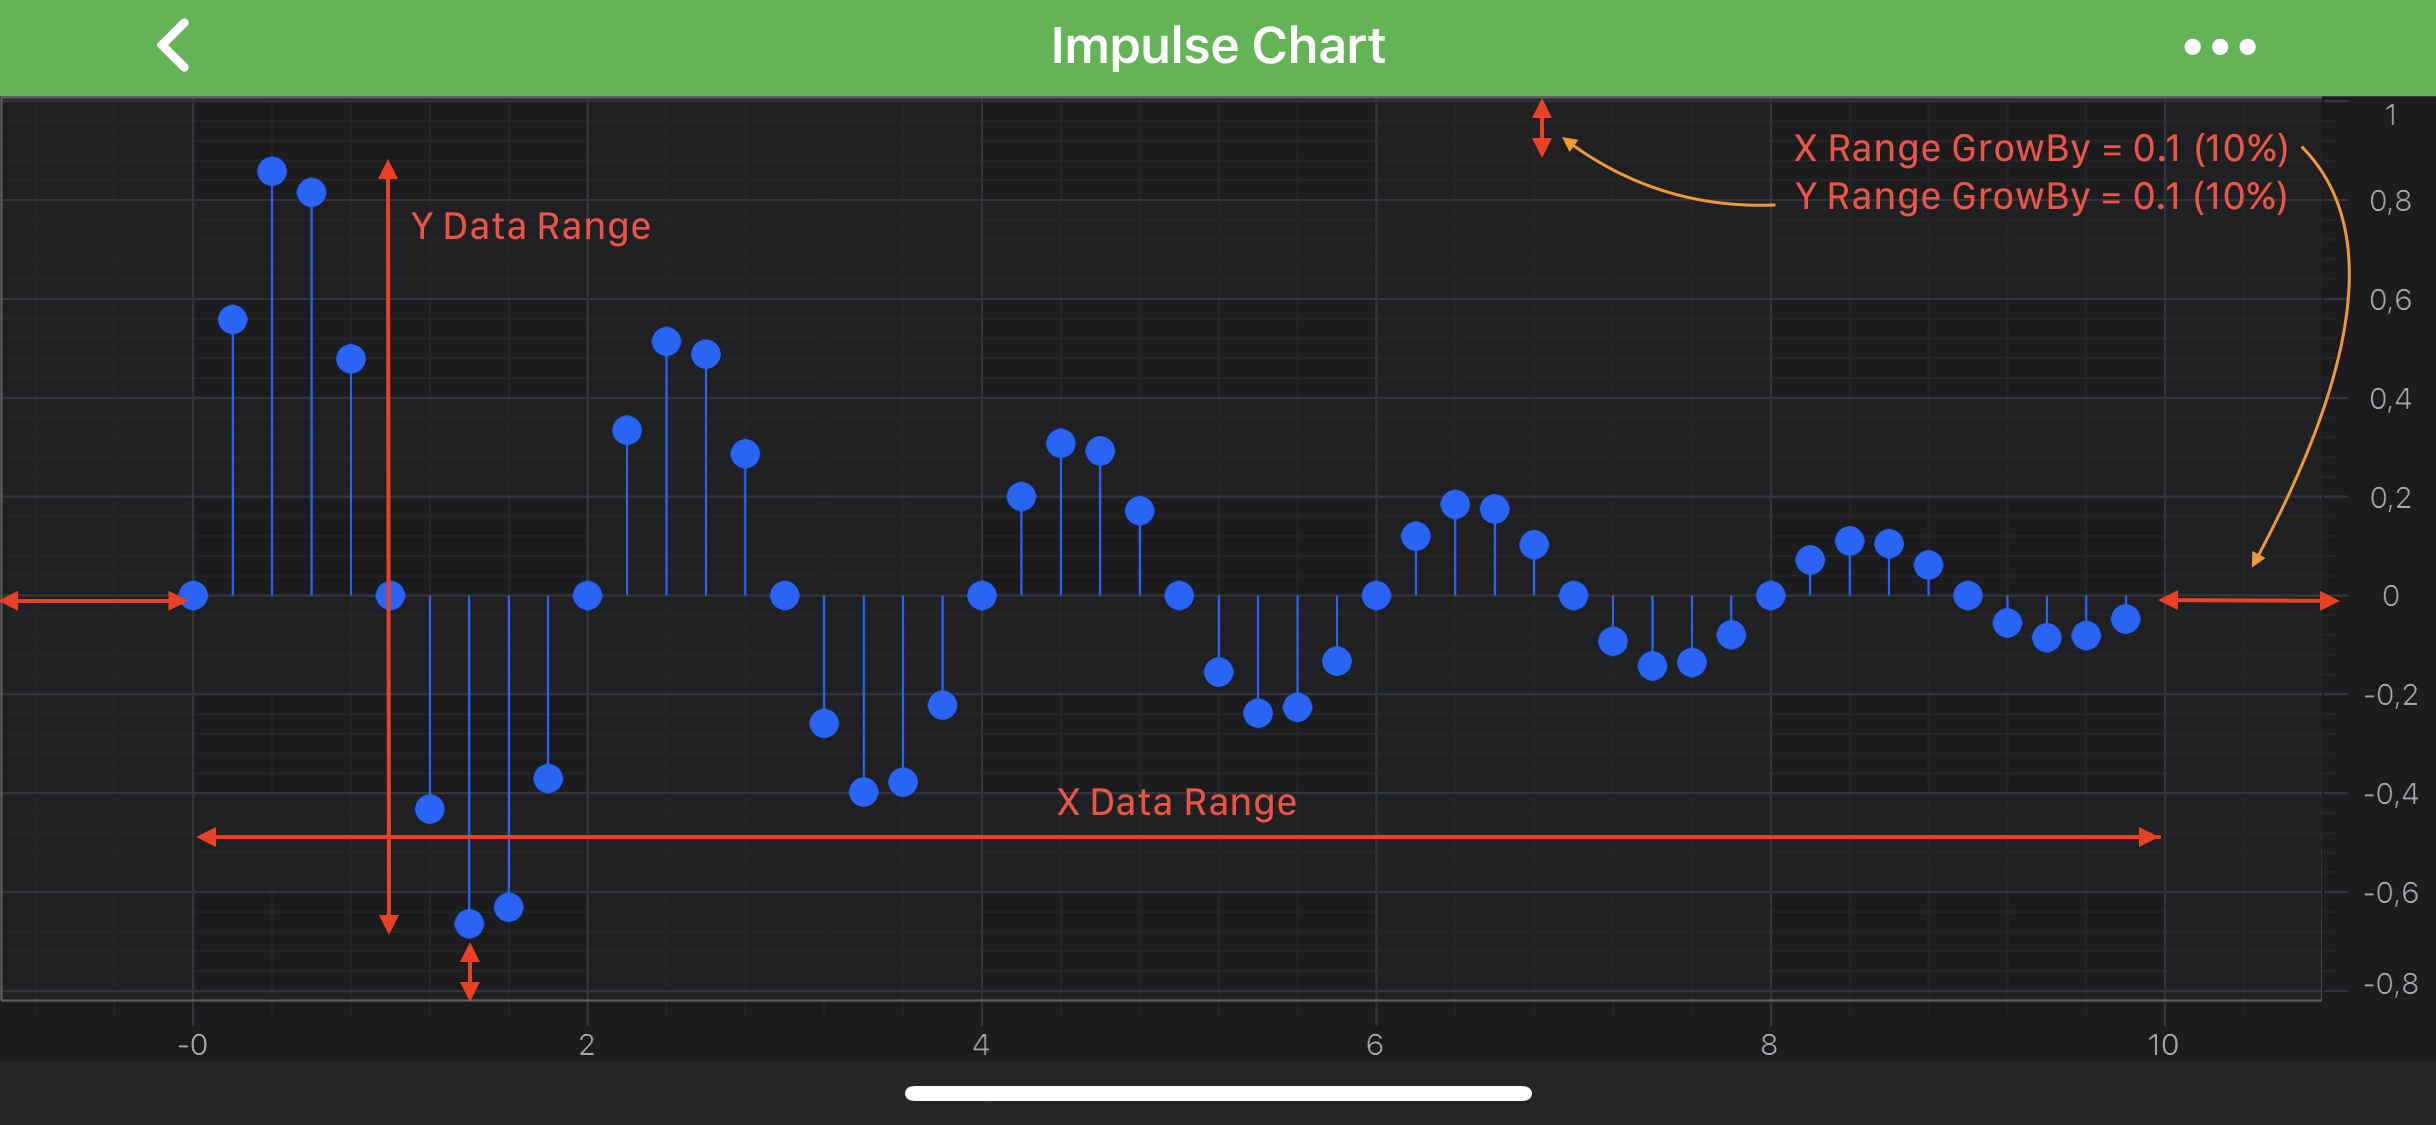
Also, it is possible to add spacing to the VisibleRange via the setGrowBy(IRange<Double> growBy) property. It allows to specify two fractions which will be always applied to the min, max values of the axes VisibleRange:
final NumericAxis axis = new NumericAxis(getContext());
axis.setGrowBy(new DoubleRange(0.1, 0.1));
axis.setVisibleRange(new DoubleRange(0.0, 10.0));
In the code snippet above, the GrowBy of 0.1 will be applied to the VisibleRange resulting in actual VisibleRange increased by a fraction of 0.1 (10%), i.e. Min = -1, Max = 11.
Zooming to fit all the Data
Sometimes it is required to make an axis to show the full extent of the data associated with it. There are several ways to achieve this in code:
- set the setVisibleRange(IRange visibleRange) to the getDataRange() value.
- configure the axis to auto adjust correspondingly to data changes. See the AutoRange article.
- call the ISciChartController methods from SciChartSurface such as zoomExtents().
- call the ISciChartController methods from IViewportManager such as zoomExtents().
To change the VisibleRange by touch interaction with a chart, please read about our ChartModifier APIs.