Templating and Styling Chart Parts
Most of the parts within SciChart can be template and styled independently of Themes
Note
Styling Chart example can be found in the SciChart Android Examples Suite as well as on GitHub:
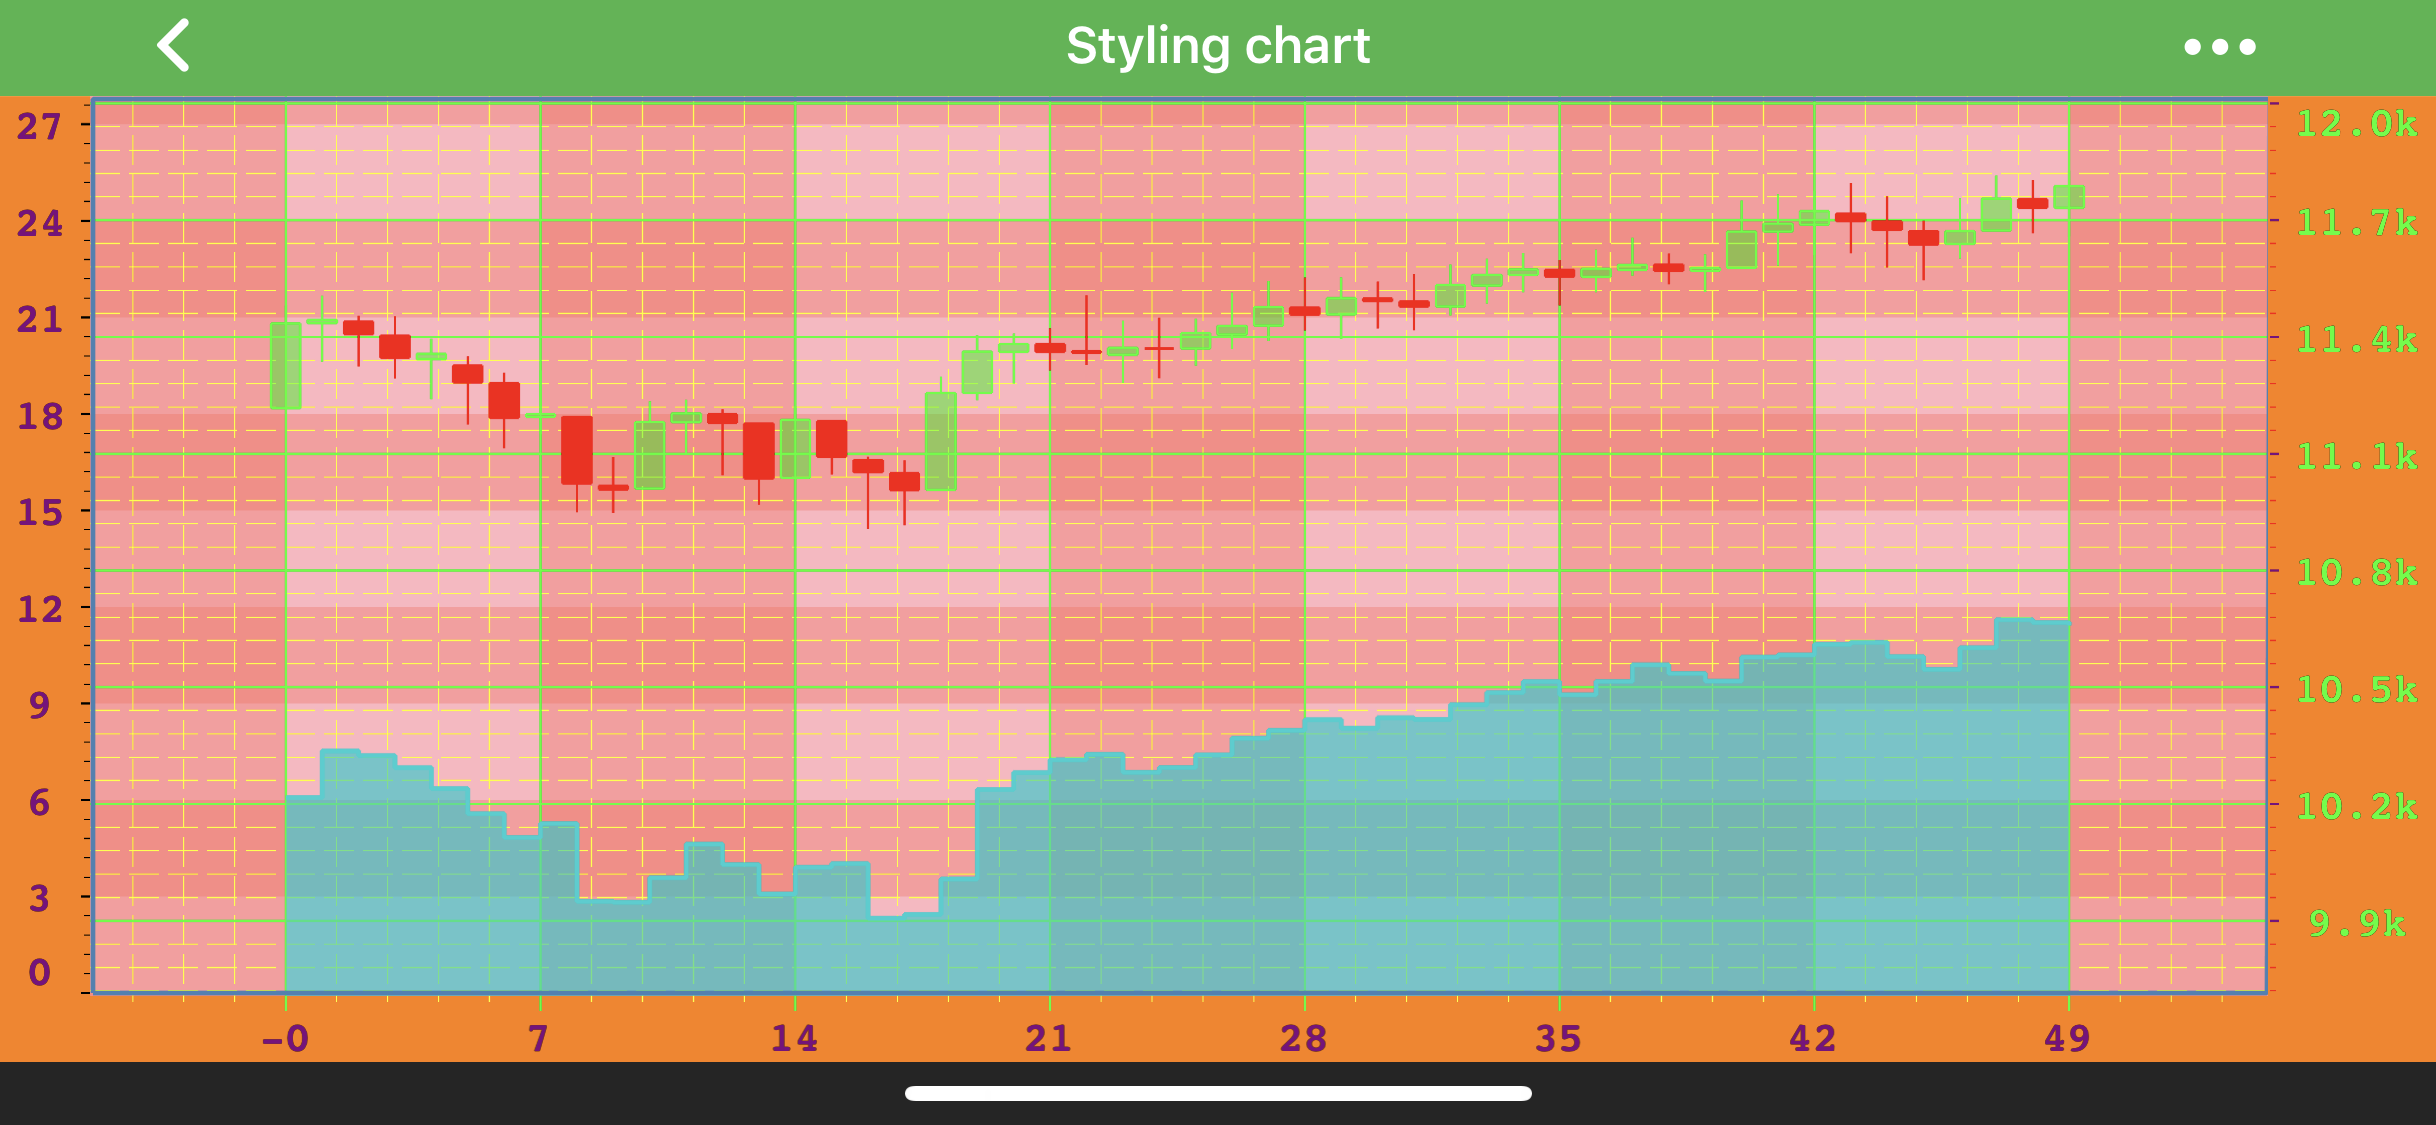
Styling the Chart Viewport
// surface background. If you set color for chart background than it is color only for axes area
surface.setBackgroundColor(ColorUtil.Orange);

// chart area (viewport) background fill color
surface.setRenderableSeriesAreaFillStyle(new SolidBrushStyle(0xFFFFB6C1));

// chart area border color and thickness
surface.setRenderableSeriesAreaBorderStyle(new SolidPenStyle(0xFF4682b4, true, 2, null));
Styling Axis
Each and Every aspect of the axis can be styled. The Axis is responsible for drawing the following parts:
- Title
- Axis Labels
- Tick Lines - small marks on the outside of an axis next to labels
- Gridlines - major and minor
- Axis Bands - shading between the major gridlines
Note
You can read more about axis styling in the following articles: