 View on GitHub
iOS & macOS Charting Documentation - SciChart iOS & macOS Charts SDK v4.x
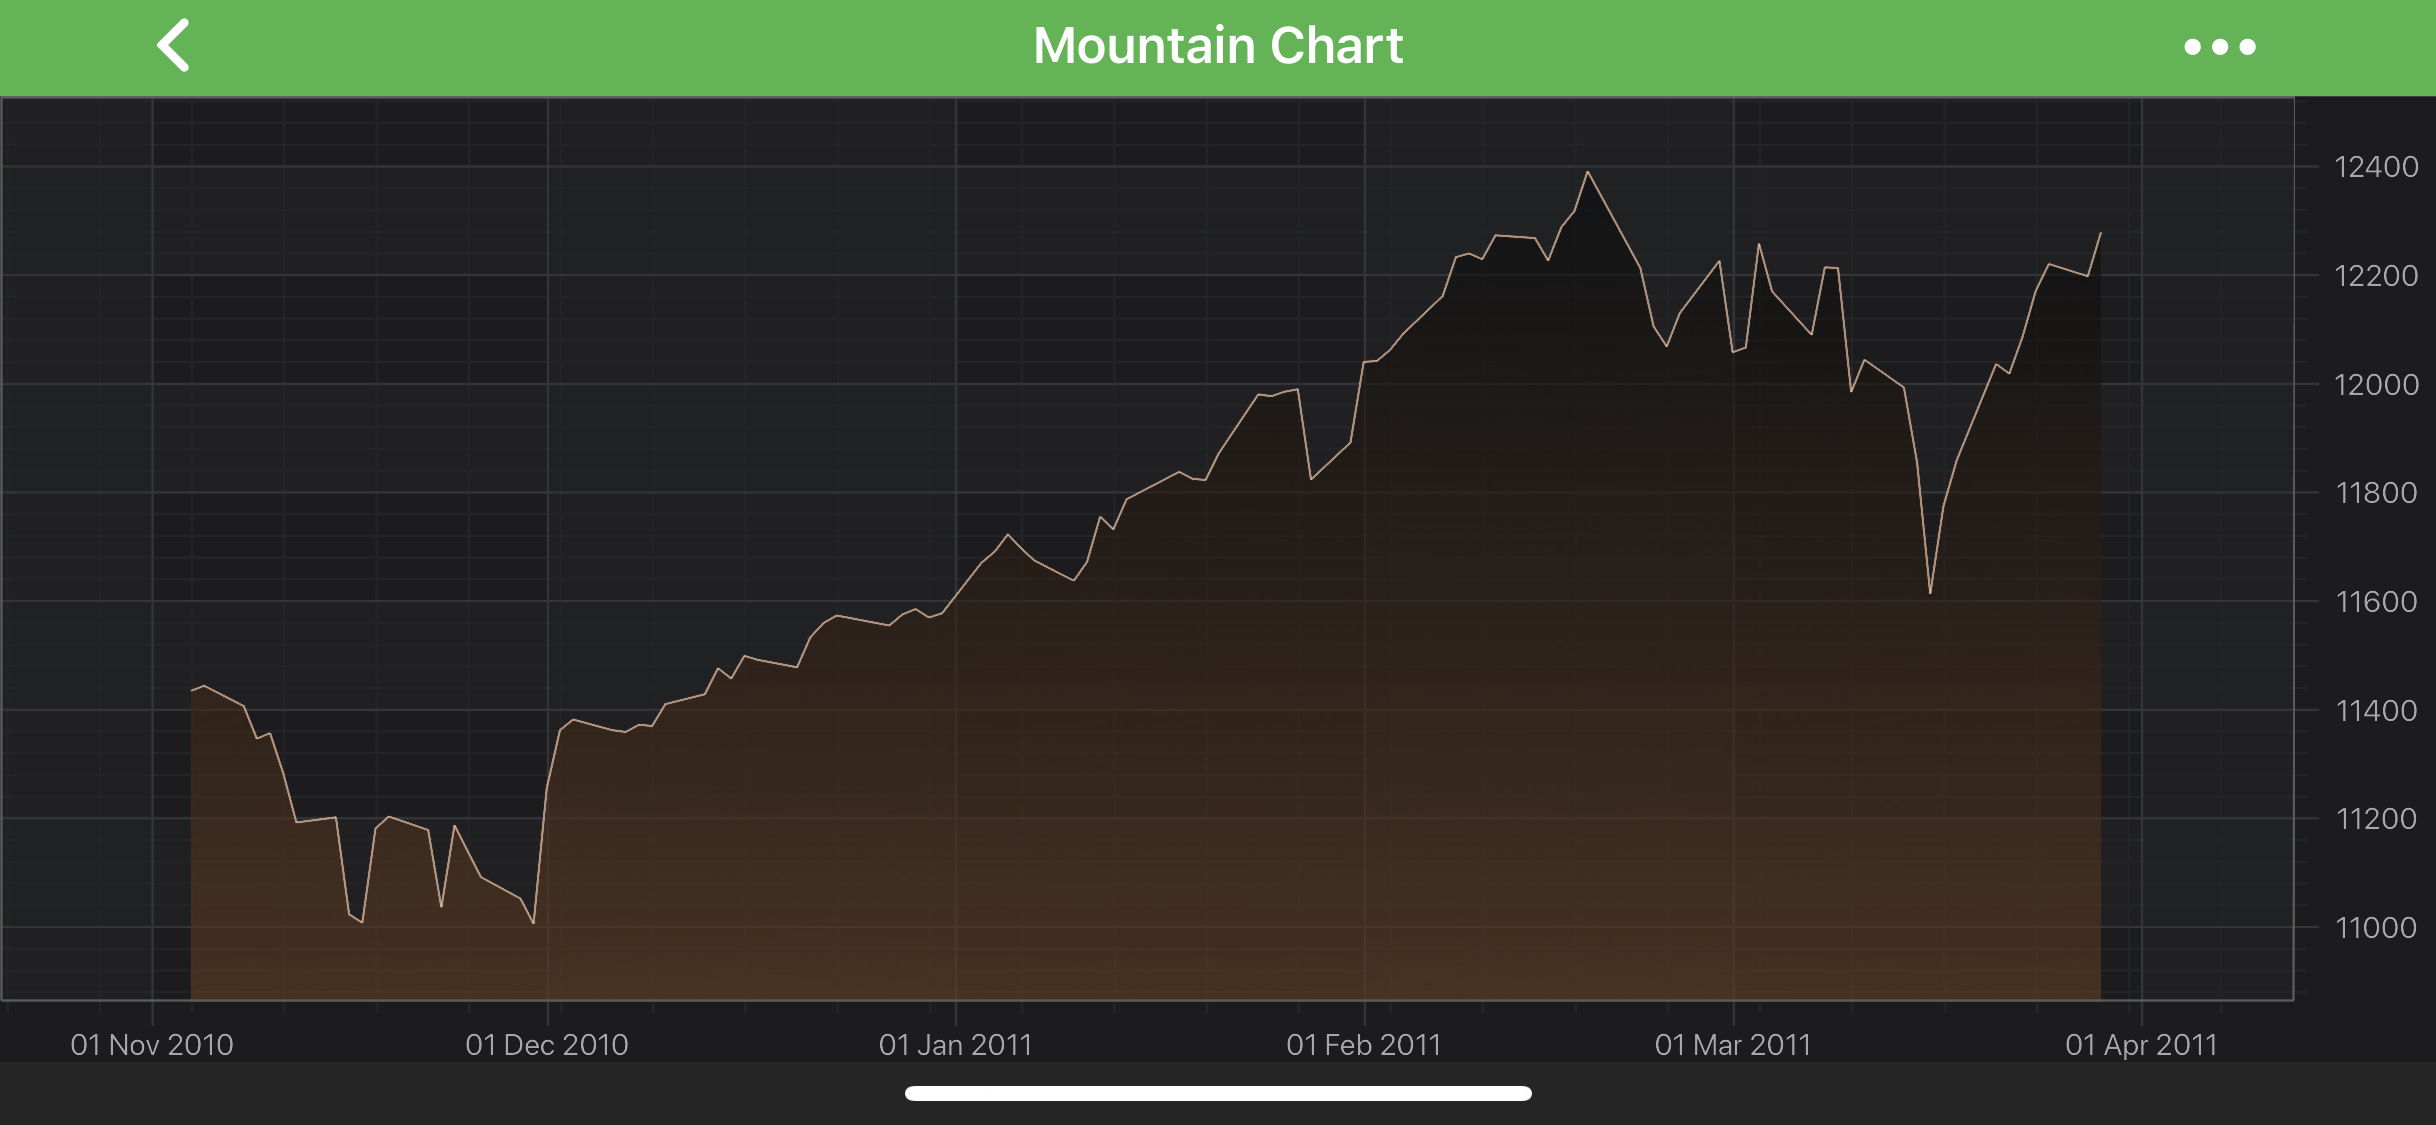
The Mountain (Area) Series Type
Mountain (Area) Series can be created using the SCIFastMountainRenderableSeries type.
NOTE: Examples of the Mountain Series can be found in the SciChart iOS Examples Suite as well as on GitHub:
The SCIFastMountainRenderableSeries class allows to specify Stroke pen and Area brush. Those values can be assigned through the corresponding properties - ISCIRenderableSeries.strokeStyle and SCIBaseMountainRenderableSeries.areaStyle accordingly.
NOTE: To learn more about Pens and Brushes and how to utilize them, please refer to the SCIPenStyle, SCIBrushStyle and SCIFontStyle article.
It is possible to define the ZeroLineY baseline position for a Mountain Series via the SCIRenderableSeriesBase.zeroLineY property. All data points that have Y value less than ZeroLineY will appear downward, else - upward.
NOTE: In multi axis scenarios, a series has to be assigned to a particular X and Y axes. This can be done by passing the axes IDs to the
ISCIRenderableSeries.xAxisId,ISCIRenderableSeries.yAxisIdproperties.
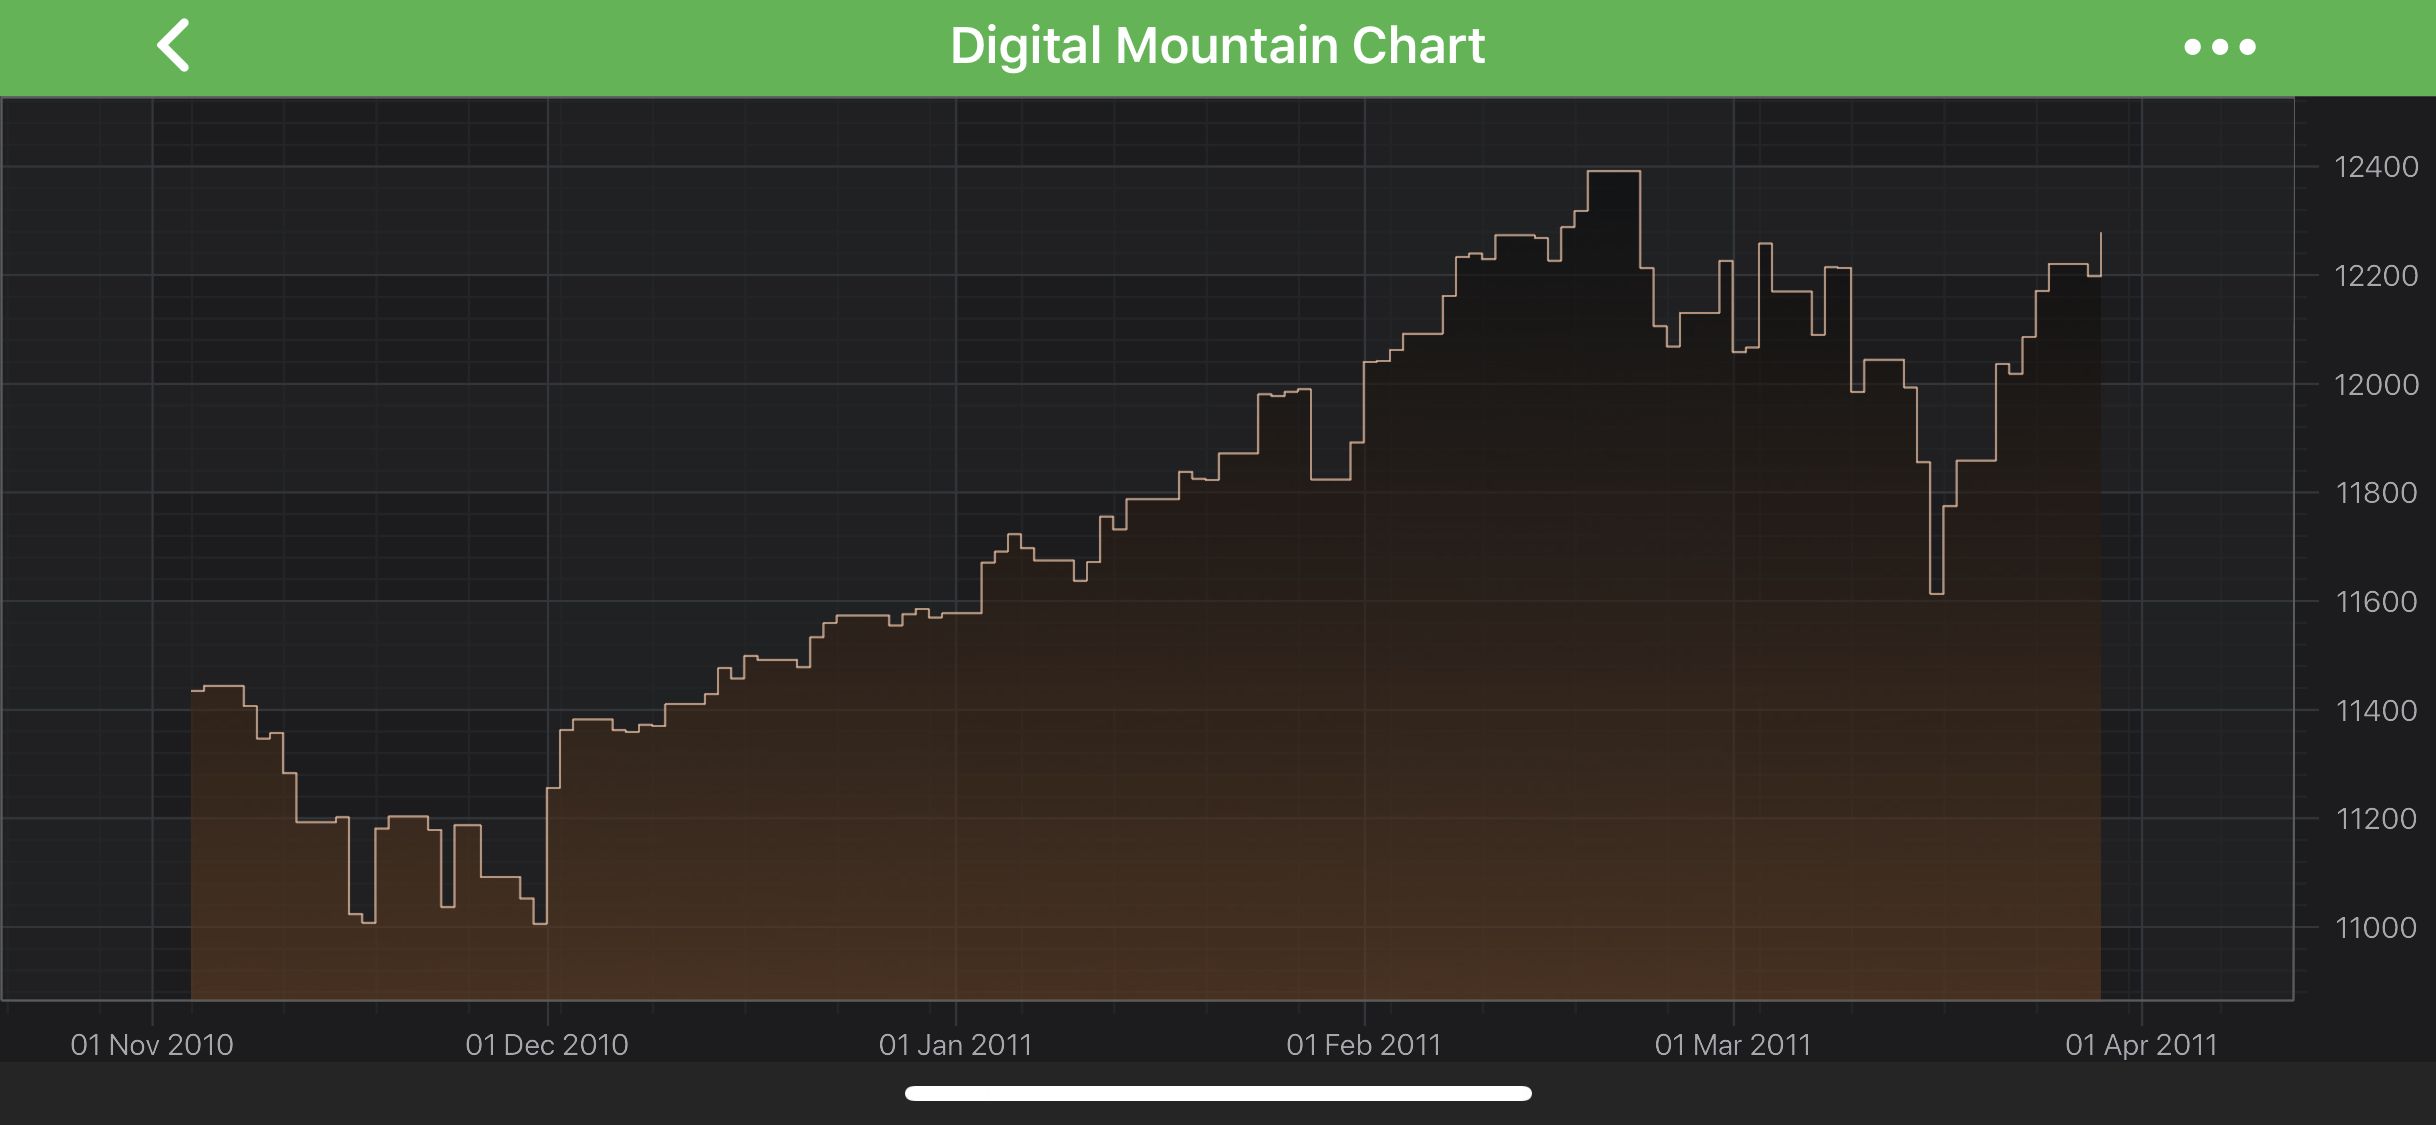
Digital (Step) Mountain Series
In addition to the above, SCIFastMountainRenderableSeries can be configured to draw as Digital (Step) Mountain. It is achieved via the
SCIBaseMountainRenderableSeries.isDigitalLine property.
Create a Mountain Series
To create a Mountain Series, use the following code:
Mountain Series Features
Mountain Series also has some features similar to other series, such as:
Render a Gap in a Mountain Series
It’s possible to render a Gap in Mountain series, by passing a data point with a NaN as the Y value. Please refer to the RenderableSeries APIs article for more details. The SCIFastMountainRenderableSeries, itself, allows to specify how a gap would appear. You can treat NAN values as a gap or a close the line. That appearance is defined by the SCIRenderableSeriesBase.drawNaNAs property (Please see SCILineDrawMode enumeration).
Add Point Markers onto a Mountain Series
Every data point of a Mountain Series can be marked with a ISCIPointMarker. To add Point Markers to a Mountain Series use the ISCIRenderableSeries.pointMarker property. For more information and code examples, please refer to the PointMarkers API article.
Paint Area Parts with Different Colors
In SciChart, you can draw Area Parts of the Mountain Series with different colors using the PaletteProvider API.
To Use palette provider for Mountain Area - a custom ISCIFillPaletteProvider (or ISCIStrokePaletteProvider) has to be provided to the ISCIRenderableSeries.paletteProvider property. Please refer to the PaletteProvider API article for more info.