 View on GitHub
iOS & macOS Charting Documentation - SciChart iOS & macOS Charts SDK v4.x
The SCIAxisMarkerAnnotation
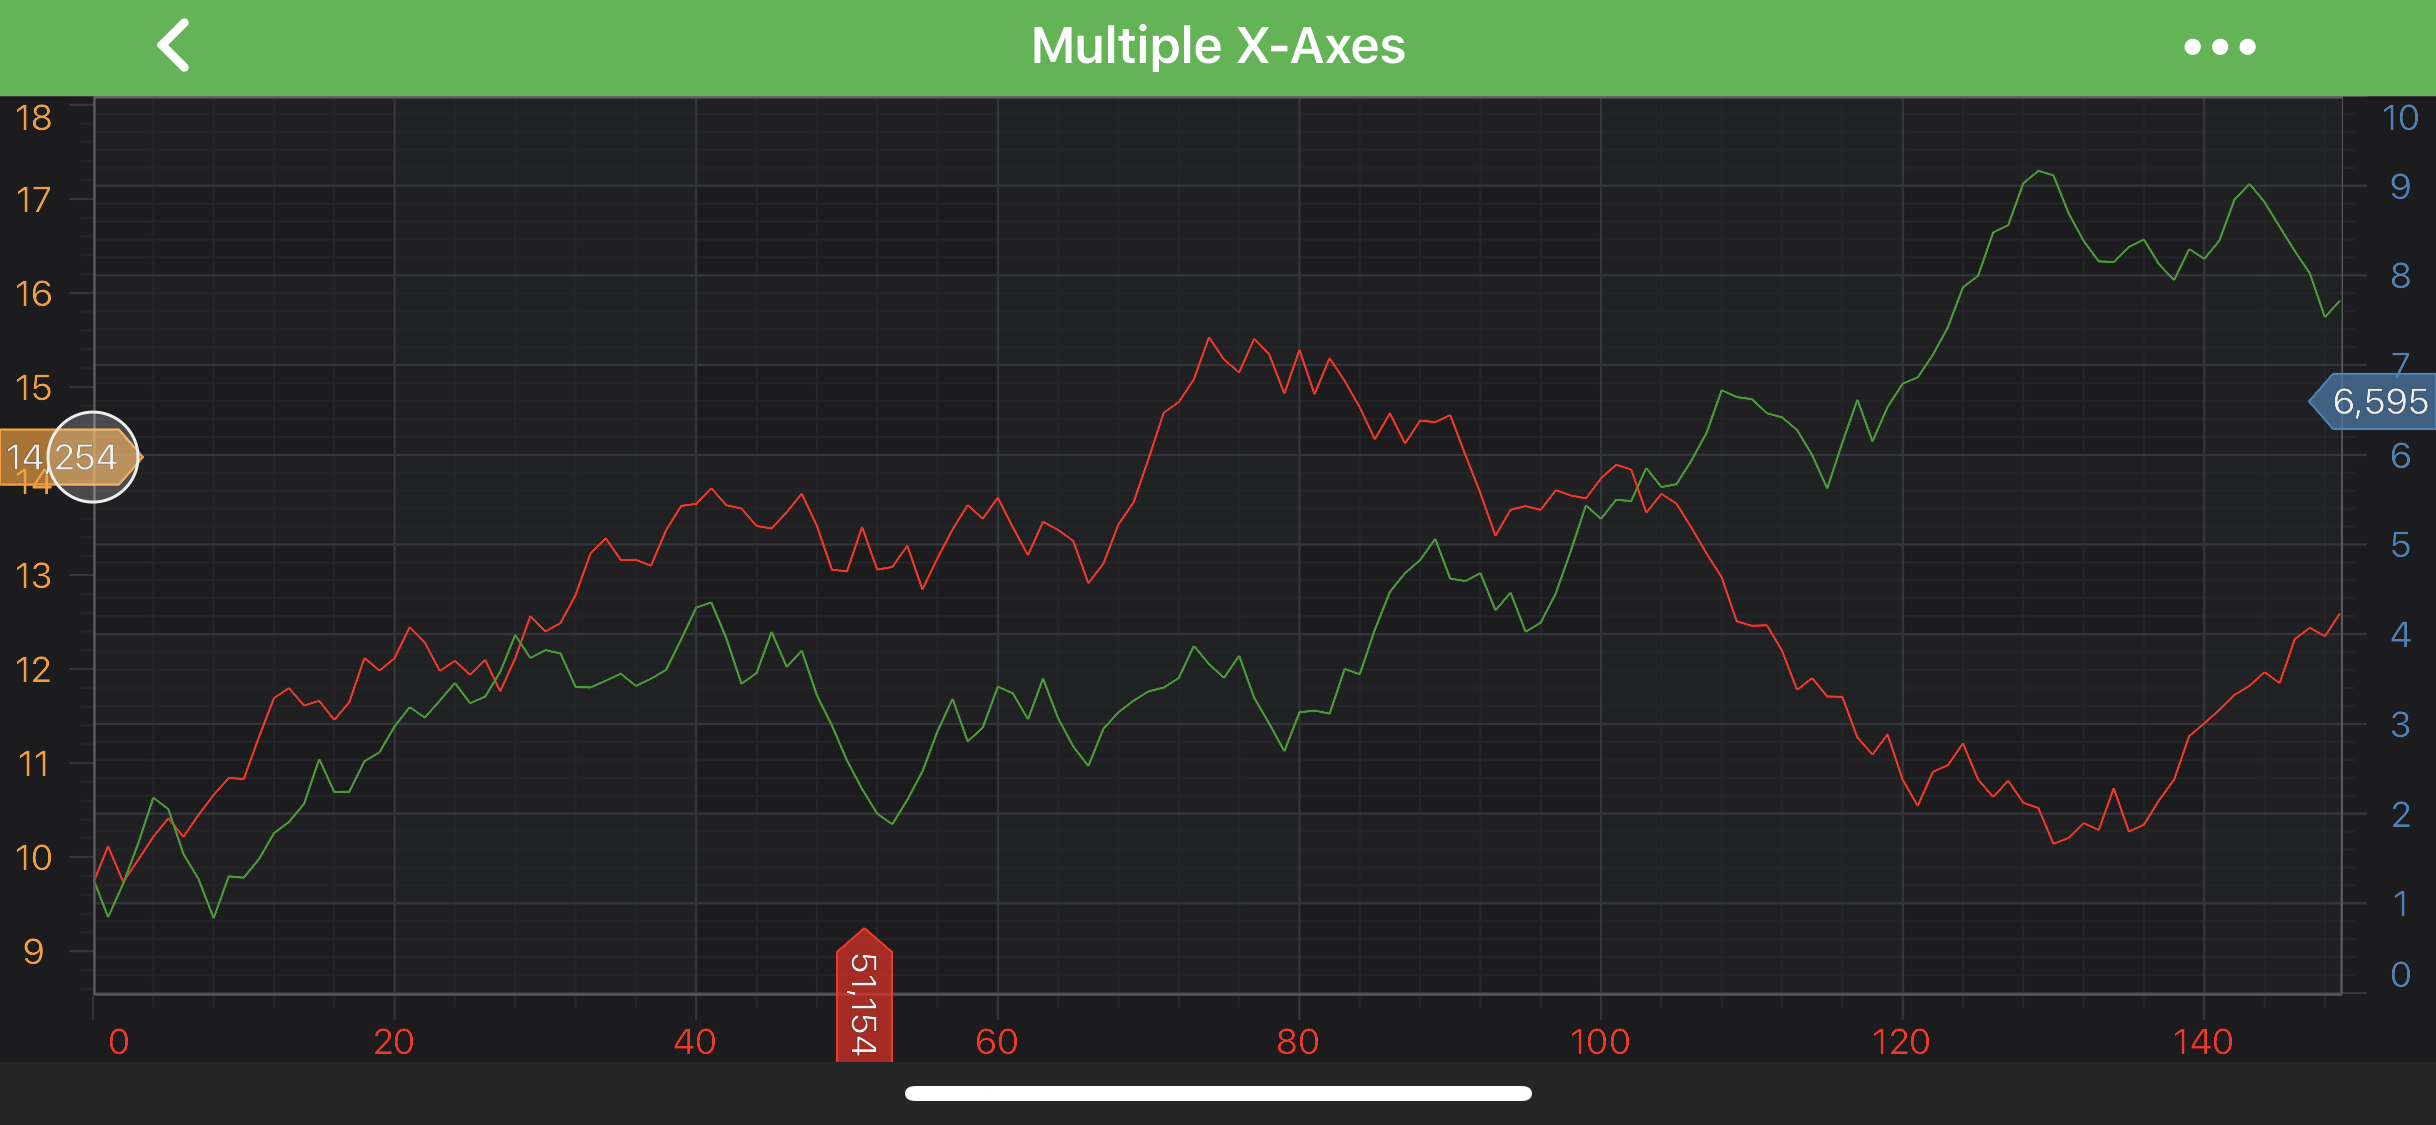
The SCIAxisMarkerAnnotation type allows to place markers with custom text onto X or Y axes.
They show the axis value at their location by default:
NOTE: Examples of the
Annotationsusage can be found in the SciChart iOS Examples Suite as well as on GitHub:
- Annotations are Easy - Obj-C/Swift, Xamarin.iOS
- Interaction with Annotations - Obj-C/Swift, Xamarin.iOS
The SCIAxisMarkerAnnotation can be configured using the properties listed in the table below:
| Feature | Description |
|---|---|
SCIAxisMarkerAnnotation.formattedValue |
Allows to specify the text that will appear on the marker. |
SCIAxisMarkerAnnotation.formattedLabelValueProvider |
Allows to override the default formatted value, which comes from an axis via an SCIAxisInfo object. Please refer to the AxisMarkerAnnotation TextFormatting section to learn more. |
SCIAxisMarkerAnnotation.fontStyle |
Determines the appearance of the text on the marker via the SCIFontStyle object. Please refer to the Styling and Theming article to learn more. |
SCIAxisMarkerAnnotation.markerPointSize |
Allows to specify the length of the pointed end of the marker. |
SCIAxisMarkerAnnotation.borderPen |
Allows to specify the outline color of the marker. |
SCIAxisMarkerAnnotation.backgroundBrush |
Allows to specify the background brush of the marker. |
NOTE: To learn more about Annotations in general - please see the Common Annotation Features article.
The SCIAxisMarkerAnnotation can be placed on the X-Axis or the Y-Axis which is specified via the ISCIAnnotation.annotationSurface property.
It accepts a member of the SCIAnnotationSurfaceEnum enumeration and it defaults to XAxis for the AxisMarkerAnnotation.
Position of the SCIAxisMarkerAnnotation is defined by the X1 or Y1 coordinate, depending on the axis.
Those values can be accessed via the ISCIAnnotation.x1 and ISCIAnnotation.y1 properties.
Also, AxisMarkerAnnotation can be aligned relative to the X1 or Y1 coordinate by setting Anchor Points.
For more information about the Anchor Points - refer to the corresponding section Annotations APIs article.
NOTE: The xAxisId and yAxisId must be supplied if you have axis with non-default Axis Ids, e.g. in multi-axis scenario.
Create an AxisMarkerAnnotation
A simple SCIAxisMarkerAnnotation can be added onto a chart using the following code:
AxisMarkerAnnotation TextFormatting
By default, the axis marker text is formatted by the ISCIAxisCore.textFormatting property. For more information, refer to the Axis Labels - TextFormatting and CursorTextFormatting article.
But you can also override the default behaviour by using textformatting by providing custom the ISCIFormattedValueProvider for your SCIAxisMarkerAnnotation corresponding property.
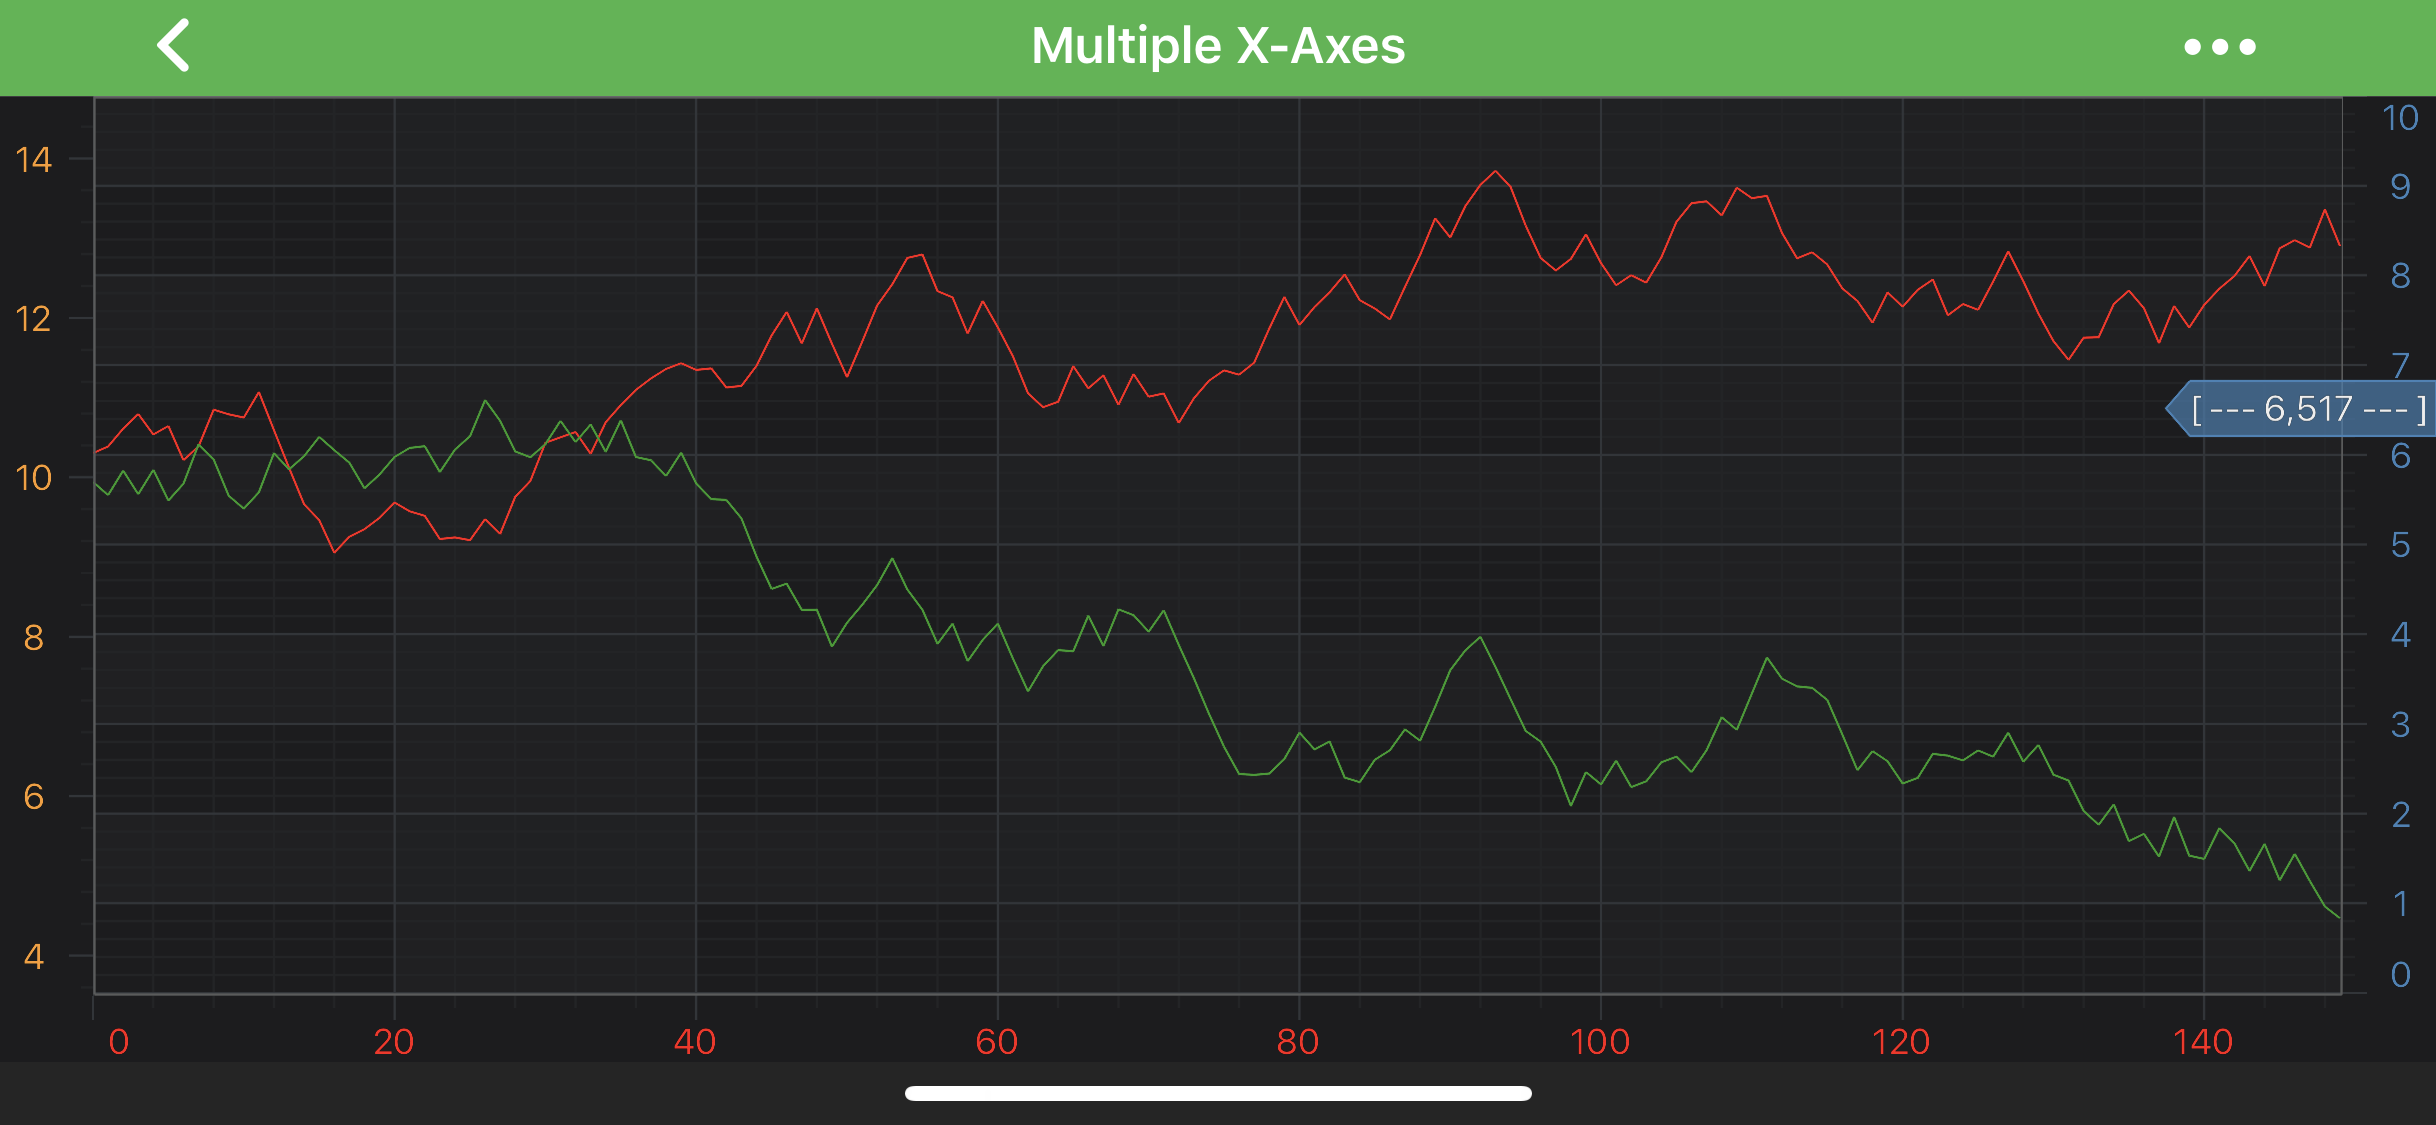
Let’s see a short example which shows how to use the above:
which will result in the following:
NOTE: To learn more about other Annotation Types, available out of the box in SciChart, please find the comprehensive list in the Annotation APIs article.