Get Started: Tutorials, Examples > Tutorials (JavaScript / npm / Webpack) > Tutorial 07 - Adding Tooltips and Legends
Tutorial 07 - Adding Tooltips and Legends

In the previous tutorial we explained how to add annotations to a JavaScript Chart using SciChart.js. In this tutorial, we are going to show you how to add tooltips and legends.

Source code for this tutorial can be found at SciChart.JS.Examples Github Repository


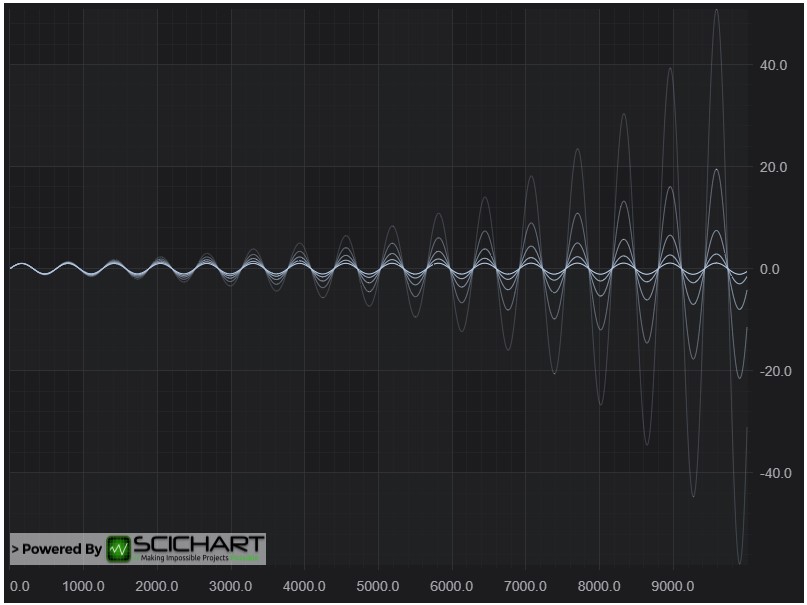
Lets create a simple chart with 5 dataseries each having 10k points.

index.js
Copy Code
import {SciChartSurface} from "scichart/Charting/Visuals/SciChartSurface";
import {NumericAxis} from "scichart/Charting/Visuals/Axis/NumericAxis";
import {XyDataSeries} from "scichart/Charting/Model/XyDataSeries";
import {FastLineRenderableSeries} from "scichart/Charting/Visuals/RenderableSeries/FastLineRenderableSeries";
async function initSciChart() {
     const {sciChartSurface, wasmContext} = await SciChartSurface.create("scichart-root");
     // Create an X,Y Axis and add to the chart
     const xAxis = new NumericAxis(wasmContext);
     const yAxis = new NumericAxis(wasmContext);
     sciChartSurface.xAxes.add(xAxis);
     sciChartSurface.yAxes.add(yAxis);
     // Create 5 dataseries, each with 10k points
     for (let seriesIndex = 0; seriesIndex < 5; seriesIndex++) {
         const xyDataSeries = new XyDataSeries(wasmContext);
         xyDataSeries.dataSeriesName = `Series ${seriesIndex}`
         const opacity = (1 - ((seriesIndex / 5))).toFixed(2);
        // Populate with some data
         for(let i = 0; i < 10000; i++) {
             xyDataSeries.append(i, Math.sin(i* 0.01) * Math.exp(i*(0.00001*(seriesIndex*10+1))));
         }
        // Add and create a line series with this data to the chart
         // Create a line series      
         const lineSeries = new FastLineRenderableSeries(wasmContext, {
             dataSeries: xyDataSeries,
            stroke: `rgba(176,196,222,${opacity})`,
             strokeThickness:2
         });
         sciChartSurface.renderableSeries.add(lineSeries);
     }
 }
 initSciChart();

So far we have created a new chart, added both X axis and Y axis and plotted 5 data series.

Add a Legend

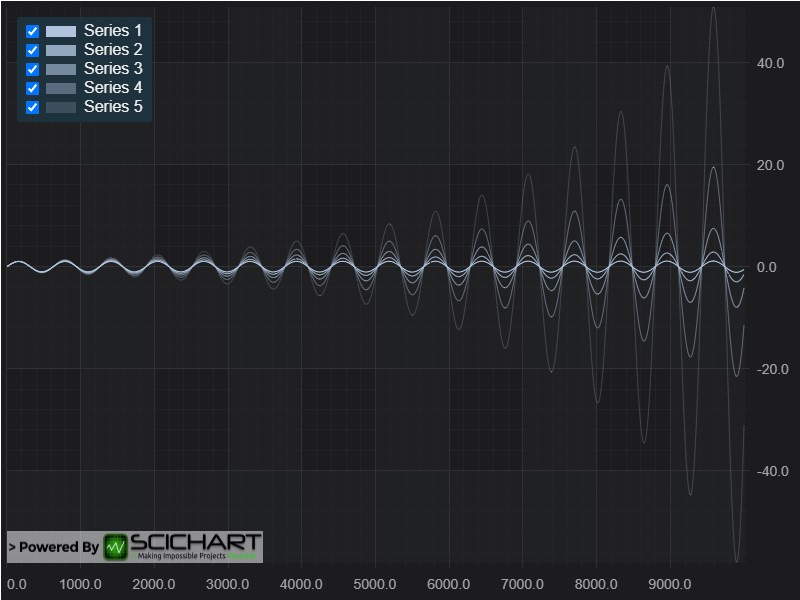
Now we will add a chart legend. In SciChart, a chart legend can be created and configured via the LegendModifier:

index.js
Copy Code
...
import {LegendModifier} from "scichart/Charting/ChartModifiers/LegendModifier";

async function initSciChart() {
    ...
    // Add a Legend
    sciChartSurface.chartModifiers.add(new LegendModifier({showCheckboxes: true}));
}
...

 This gives us the Legend, which displays checkboxes to show/hide the series, series markers and series names.

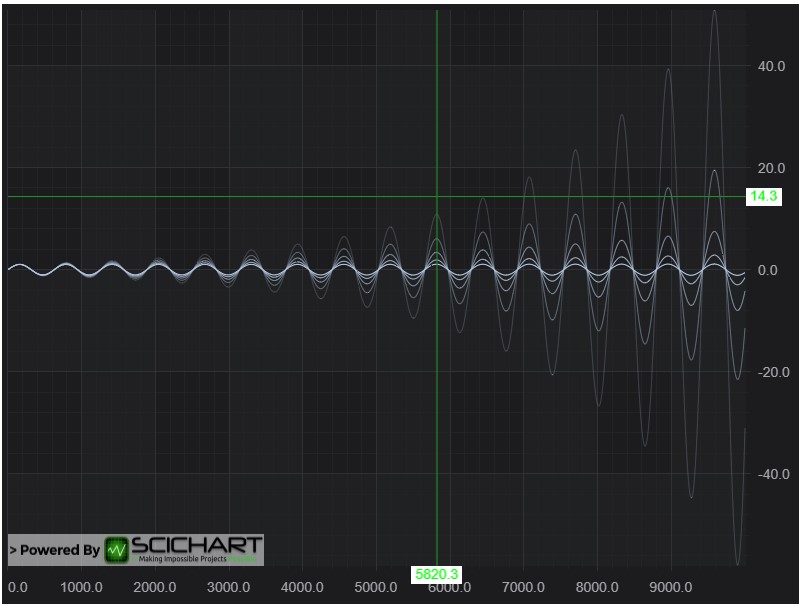
Add a Cursor (Crosshair)

CursorModifier adds a crosshair onto a SciChartSurface. When you place the cursor over the SciChartSurface, it shows X and Y values of the current point in tooltips over the Axes.

index.js
Copy Code
        
...
import {CursorModifier} from "scichart/Charting/ChartModifiers/CursorModifier";

async function initSciChart() {
    ...
    // Add axis label tooltips using CursorModifier
    const cursorModifier = new CursorModifier();
    cursorModifier.axisLabelsFill = "#FFFFFF";
    cursorModifier.axisLabelsStroke = "#00FF00";
    sciChartSurface.chartModifiers.add(cursorModifier);
}

initSciChart();

 It gives us the result:

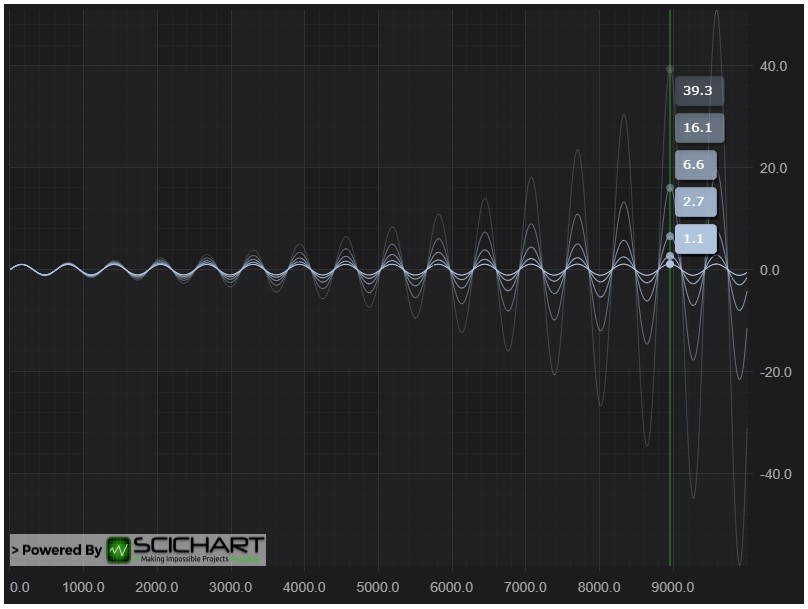
Add a RolloverModifier Tooltip

Tooltips may be added to the SciChartSurface using the RolloverModifier. This is a ChartModifierBase derived type which is attached to the SciChartSurface.chartModifiers property.

Remove the previous CursorModifier from the chart. Now add a RolloverModifier by add this code:

index.js
Copy Code
...
import {RolloverModifier} from "scichart/Charting/ChartModifiers/RolloverModifier";

async function initSciChart() {
    ...
    // Add a tooltip behavior using the RolloverModifier
    const tooltipModifier = new RolloverModifier(wasmContext);
    sciChartSurface.chartModifiers.add(tooltipModifier);
}

initSciChart();

That gives us the chart with tooltips being displayed for each series: 

Further Reading

To learn more about cursors and legends in SciChart please find links to the corresponding documentation articles below: