What is a RenderableSeries3D?
The RenderableSeries3D in SciChart3D are visual representations of X,Y,Z numeric, TimeSpan, or DateTime data. Some RenderableSeries3D render simple X,Y,Z values (e.g. scatter points in 3D space), while some render additional information (such as height-maps or surfaces with color palettes).
The 3D RenderableSeries all inherit BaseRenderableSeries3D and are defined in XAML (or in code) in the SciChart3DSurface.RenderableSeries collection. This collection supports multiple 3D RenderableSeries of differing types. Each 3D RenderableSeries is rendered to the screen, from data from an associated DataSeries3D.
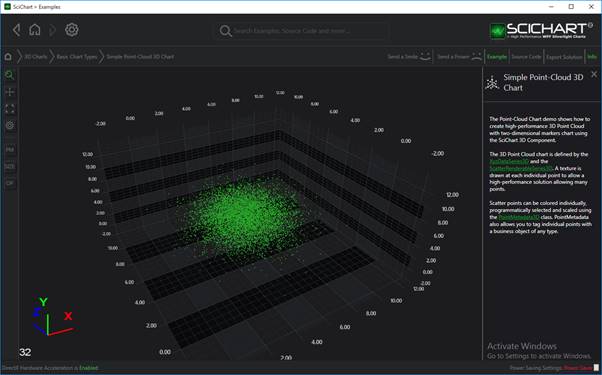
Point Cloud 3D
Point Cloud Series are provided by the ScatterRenderableSeries3D type, with a two-dimensional PointMarker applied.
NOTE: Scatter series in SciChart support 3D and 2D point-markers. The 2D marker types have fewer vertices and hence can be used in higher performance scenarios such as real-time point clouds.
To declare a point cloud using the ScatterRenderableSeries3D use the following code:
Declare a 3D Point Cloud in Xaml / Code Behind
<s3D:SciChart3DSurface.RenderableSeries>
<!-- Declares the ScatterRenderableSeries3D. Data is applied in code-behind -->
<s3D:ScatterRenderableSeries3D x:Name="ScatterSeries3D">
<s3D:ScatterRenderableSeries3D.PointMarker>
<!-- Declares a flat textured ellipse of size 1.0 (world coord) for points -->
<s3D:EllipsePointMarker3D Fill="LimeGreen" Size="1.0" Opacity="1"/>
</s3D:ScatterRenderableSeries3D.PointMarker>
</s3D:ScatterRenderableSeries3D>
</s3D:SciChart3DSurface.RenderableSeries>
<!-- XAxis, YAxis, ZAxis omitted for brevity -->
</s3D:SciChart3DSurface>
// Code Behind, e.g. in OnLoaded event handler, set the DataSeries
var dataSeries = new XyzDataSeries3D<double, double, double>();
var r = new Random();
for(int i = 0; i < 100; i++)
dataSeries.Append(r.NextDouble(), r.NextDouble(), r.NextDouble());
ScatterSeries3D.DataSeries = dataSeries;
Declare a 3D Point Cloud in Pure Code
// Create the SciChart3DSurface
var scs = new SciChart3DSurface
{
XAxis = new NumericAxis3D(),
YAxis = new NumericAxis3D(),
ZAxis = new NumericAxis3D()
};
// Create and assign the ScatterRenderableSeries3D
var scatterSeries3D = new ScatterRenderableSeries3D()
{
PointMarker = new EllipsePointMarker3D()
{
Fill = Colors.Green,
Size = 1.0f,
Opacity = 1.0,
}
};
scs.RenderableSeries.Add(scatterSeries3D);
// Create and assign the XYZ Data
var dataSeries = new XyzDataSeries3D<double, double, double>();
var r = new Random();
for (int i = 0; i < 100; i++)
dataSeries.Append(r.NextDouble(), r.NextDouble(), r.NextDouble());
scatterSeries3D.DataSeries = dataSeries;
NOTE: Any type which derives from BasePointMarker3D can be assigned to the ScatterRenderableSeries3D.PointMarker property. Valid 2D (flat) Point Markers include EllipsePointMarker3D, QuadPointMarker3D, PixelPointMarker3D, TrianglePointMarker3D. Valid 3D Point Markers include SpherePointMarker3D, CubePointMarker3D, CylinderPointMarker3D and PyramidPointMarker3D.
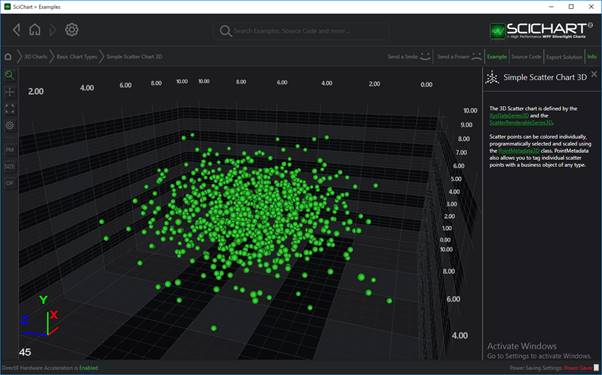
Scatter 3D
3D Scatter Series are provided by the ScatterRenderableSeries3D type, with a three-dimensional PointMarker applied.
NOTE: Scatter series in SciChart support 3D and 2D point-markers. The 3D marker types have more vertices and hence are recommended for a better visual appearance, but won’t support as many points as 2D flat point-marker types.
To declare a 3D Scatter Chart using the ScatterRenderableSeries3D use the following code:
Declare a 3D Scatter Chart in Xaml / Code Behind
<s3D:SciChart3DSurface.RenderableSeries>
<!-- Declares the ScatterRenderableSeries3D. Data is applied in code-behind -->
<s3D:ScatterRenderableSeries3D x:Name="ScatterSeries3D">
<s3D:ScatterRenderableSeries3D.PointMarker>
<!-- Declares a flat textured ellipse of size 1.0 (world coord) for points -->
<s3D:SpherePointMarker3D Fill="LimeGreen" Size="4.0" Opacity="1"/>
</s3D:ScatterRenderableSeries3D.PointMarker>
</s3D:ScatterRenderableSeries3D>
</s3D:SciChart3DSurface.RenderableSeries>
<!-- XAxis, YAxis, ZAxis omitted for brevity -->
</s3D:SciChart3DSurface>
// Code Behind, e.g. in OnLoaded event handler, set the DataSeries
var dataSeries = new XyzDataSeries3D<double, double, double>();
var r = new Random();
for(int i = 0; i < 100; i++)
dataSeries.Append(r.NextDouble(), r.NextDouble(), r.NextDouble());
ScatterSeries3D.DataSeries = dataSeries;
Declare a 3D Scatter Chart in Pure Code
// Create the SciChart3DSurface
var scs = new SciChart3DSurface
{
XAxis = new NumericAxis3D(),
YAxis = new NumericAxis3D(),
ZAxis = new NumericAxis3D()
};
// Create and assign the ScatterRenderableSeries3D
var scatterSeries3D = new ScatterRenderableSeries3D()
{
PointMarker = new SpherePointMarker3D()
{
Fill = Colors.Green,
Size = 4.0f,
Opacity = 1.0,
}
};
scs.RenderableSeries.Add(scatterSeries3D);
// Create and assign the XYZ Data
var dataSeries = new XyzDataSeries3D<double, double, double>();
var r = new Random();
for (int i = 0; i < 100; i++)
dataSeries.Append(r.NextDouble(), r.NextDouble(), r.NextDouble());
scatterSeries3D.DataSeries = dataSeries;
NOTE: Any type which derives from BasePointMarker3D can be assigned to the ScatterRenderableSeries3D.PointMarker property. Valid 2D (flat) Point Markers include EllipsePointMarker3D, QuadPointMarker3D, PixelPointMarker3D, TrianglePointMarker3D. Valid 3D Point Markers include SpherePointMarker3D, CubePointMarker3D, CylinderPointMarker3D and PyramidPointMarker3D.
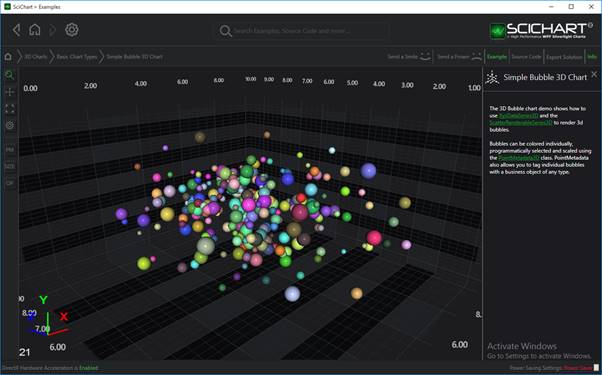
Bubble 3D
3D Bubble Series are provided by the ScatterRenderableSeries3D type, with a three-dimensional BasePointMarker3D derived type and PointMetadata3D instance which defines the bubble size.
NOTE: Scatter series in SciChart support 3D and 2D point-markers with optional per-point coloring and sizing. Color/Size is provided by the PointMetadata3D type, an optional fourth component in the XyzDataSeries3D.
To declare a 3D Bubble Chart using the ScatterRenderableSeries3D use the following code:
Declare a 3D Bubble Chart in Xaml / Code Behind
<s3D:SciChart3DSurface.RenderableSeries>
<!-- Declares the ScatterRenderableSeries3D. Data is applied in code-behind -->
<s3D:ScatterRenderableSeries3D x:Name="ScatterSeries3D">
<s3D:ScatterRenderableSeries3D.PointMarker>
<!-- Declares a flat textured ellipse of size 1.0 (world coord) for points -->
<s3D:SpherePointMarker3D Fill="LimeGreen"
Size="2.0" Opacity="1"/>
</s3D:ScatterRenderableSeries3D.PointMarker>
</s3D:ScatterRenderableSeries3D>
</s3D:SciChart3DSurface.RenderableSeries>
<!-- XAxis, YAxis, ZAxis omitted for brevity -->
</s3D:SciChart3DSurface>
// Code Behind, e.g. in OnLoaded event handler, set the DataSeries
var dataSeries = new XyzDataSeries3D<double, double, double>();
var r = new Random();
for(int i = 0; i < 100; i++)
{
// Scale is a multiplier used to increase/decrease
// ScatterRenderableSeries3D.ScatterPointSize
var scale = (float) ((r.NextDouble() + 0.5)*3.0);
// Color is applied to PointMetadata3D and overrides the default Fill property
Color? randomColor = Color.FromArgb(0xFF,
(byte) r.Next(50, 255),
(byte) r.Next(50, 255),
(byte) r.Next(50, 255));
// Append X,Y,Z location and W PointMetadata for color/size info
dataSeries.Append(r.NextDouble(), r.NextDouble(), r.NextDouble(),
new PointMetadata3D(randomColor, scale));
}
ScatterSeries3D.DataSeries = dataSeries;
Declare a 3D Bubble Chart in Pure Code
// Create the SciChart3DSurface
var scs = new SciChart3DSurface
{
XAxis = new NumericAxis3D(),
YAxis = new NumericAxis3D(),
ZAxis = new NumericAxis3D()
};
// Create and assign the ScatterRenderableSeries3D
var scatterSeries3D = new ScatterRenderableSeries3D()
{
PointMarker = new SpherePointMarker3D()
{
Fill = Colors.Green,
Size = 1.0f,
Opacity = 1.0,
}
};
scs.RenderableSeries.Add(scatterSeries3D);
// Create and assign the XYZ Data
var dataSeries = new XyzDataSeries3D<double, double, double>();
var r = new Random();
for(int i = 0; i < 100; i++)
{
// Scale is a multiplier used to increase/decrease
// ScatterRenderableSeries3D.ScatterPointSize
var scale = (float) ((r.NextDouble() + 0.5)*3.0);
// Color is applied to PointMetadata3D and overrides the default Fill property
Color? randomColor = Color.FromArgb(0xFF,
(byte) r.Next(50, 255),
(byte) r.Next(50, 255),
(byte) r.Next(50, 255));
// Append X,Y,Z location and W PointMetadata for color/size info
dataSeries.Append(r.NextDouble(), r.NextDouble(), r.NextDouble(),
new PointMetadata(randomColor, scale);
}
scatterSeries3D.DataSeries = dataSeries;
NOTE: Any type which derives from BasePointMarker3D can be assigned to the ScatterRenderableSeries3D.PointMarker property. Valid 2D (flat) Point Markers include EllipsePointMarker3D, QuadPointMarker3D, PixelPointMarker3D, TrianglePointMarker3D. Valid 3D Point Markers include SpherePointMarker3D, CubePointMarker3D, CylinderPointMarker3D and PyramidPointMarker3D.
Column 3D
3D Column Series are provided by the ColumnRenderableSeries3D type, with a three-dimensional BasePointMarker3D derived type and optional PointMetadata3D instance which defines the per-column color.
NOTE: 3D Column Charts support both sparse (XYZ) data and uniform (Y only) data. This example covers sparse data in the form of XYZ Points.
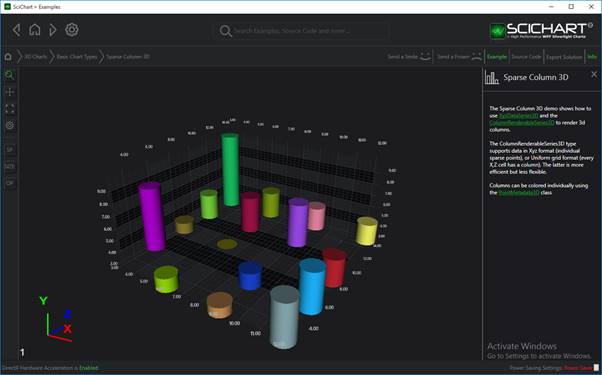
To declare a 3D Column Chart using the ColumnRenderableSeries3D use the following code:
Declare a 3D Column Chart in Xaml / Code Behind
<s3D:SciChart3DSurface>
<s3D:SciChart3DSurface.RenderableSeries>
<!-- Declares the ColumnRenderableSeries3D. Data is applied in code-behind -->
<s3D:ColumnRenderableSeries3D x:Name="ColumnRenderableSeries3D"
ColumnShape="{x:Type s3D:CylinderPointMarker3D}"
Opacity="1">
</s3D:ColumnRenderableSeries3D>
</s3D:SciChart3DSurface.RenderableSeries>
<!-- XAxis, YAxis, ZAxis -->
<s3D:NumericAxis3D/>
</s3D:SciChart3DSurface.XAxis>
<s3D:SciChart3DSurface.YAxis>
<s3D:NumericAxis3D/>
</s3D:SciChart3DSurface.YAxis>
<s3D:SciChart3DSurface.ZAxis>
<s3D:NumericAxis3D/>
</s3D:SciChart3DSurface.ZAxis>
</s3D:SciChart3DSurface>
// Code Behind, e.g. in OnLoaded event handler, set the DataSeries
var xyzDataSeries3D = new XyzDataSeries3D<double, double, double>();
var r = new Random();
const int Count = 15;
for (var i = 1; i < Count; i++)
{
for (var j = 1; j <= Count; j++)
{
if (i != j && i % 3 == 0 && j % 3 == 0)
{
var y = r.NextDouble();
var randomColor = Color.FromArgb(0xFF, (byte)r.Next(0, 255), (byte)r.Next(0, 255), (byte)r.Next(0, 255));
xyzDataSeries3D.Append(i, y, j, new PointMetadata3D(randomColor));
}
}
}
ColumnRenderableSeries3D.DataSeries = xyzDataSeries3D;
Declare a 3D Column Chart in Pure Code
// Create the SciChart3DSurface
var scs = new SciChart3DSurface
{
XAxis = new NumericAxis3D(),
YAxis = new NumericAxis3D(),
ZAxis = new NumericAxis3D()
};
// Create and assign the ColumnRenderableSeries3D
var columnSeries3D = new ColumnRenderableSeries3D()
{
ColumnShape = typeof(CylinderPointMarker3D),
};
scs.RenderableSeries.Add(columnSeries3D);
// Code Behind, e.g. in OnLoaded event handler, set the DataSeries
var xyzDataSeries3D = new XyzDataSeries3D<double, double, double>();
var r = new Random();
const int Count = 15;
for (var i = 1; i < Count; i++)
{
for (var j = 1; j <= Count; j++)
{
if (i != j && i % 3 == 0 && j % 3 == 0)
{
var y = r.NextDouble();
var randomColor = Color.FromArgb(0xFF, (byte)r.Next(0, 255), (byte)r.Next(0, 255), (byte)r.Next(0, 255));
xyzDataSeries3D.Append(i, y, j, new PointMetadata3D(randomColor));
}
}
}
columnSeries3D.DataSeries = xyzDataSeries3D;
Declaring a 3D Column Series with Uniform Grid Data
The ColumnRenderableSeries3D accepts data from the XyzDataSeries3D or UniformGridDataSeries3D. In the case of uniform data, the column series renders like this:
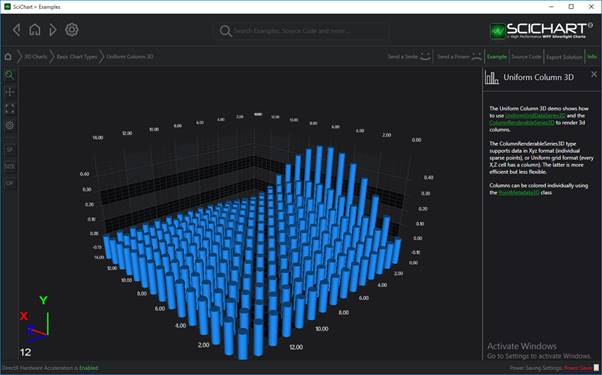
In this case the only change we make to the example is to change the data-source. Instead of XyzDataSeries3D, we use UniformGridDataSeries3D. This expects a 2D array of Y-values e.g. double[][], and has a fixed size in Z and X. Each ‘cell’ (each X-Z location) in the grid is filled with a column with height defined by the Y-value. X,Z values are computed from the UniformGridDataSeries3D.StartX, StepX, StartZ, StepZ properties.
var uniformDataSeries = new UniformGridDataSeries3D<double>(Count, Count)
{
StepX = 1, StepZ = 1
};
for (var x = 0; x < Count; x++)
{
for (var z = 0; z < Count; z++)
{
var y = Math.Sin(x * 0.25) / ((z + 1) * 2);
uniformDataSeries[x, z] = y;
}
}
ColumnRenderableSeries3D.DataSeries = uniformDataSeries;
Impulse (Stem) 3D
3D Impulse Series (Stem Charts) are provided by the ImpulseRenderableSeries3D type, with a three-dimensional BasePointMarker3D derived type and optional PointMetadata3D instance which defines the per-stem color.
NOTE: 3D Stem Charts support both sparse (XYZ) data and uniform (Y only) data. This example covers sparse data in the form of XYZ Points.
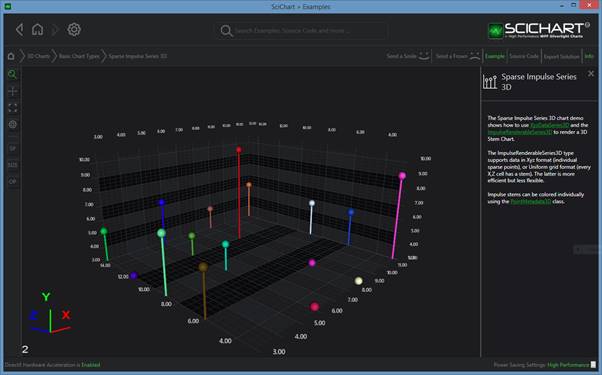
To declare a 3D Stem Chart using the ImpulseRenderableSeries3D use the following code:
Declare a 3D Stem Chart in Xaml / Code Behind
<s3D:SciChart3DSurface>
<s3D:SciChart3DSurface.RenderableSeries>
<!-- Declares the ColumnRenderableSeries3D. Data is applied in code-behind -->
<s3D:ImpulseRenderableSeries3D x:Name="ImpulseRenderableSeries3D" Opacity="1"
Stroke="LimeGreen" StrokeThickness="1.0">
<s3D:ImpulseRenderableSeries3D.PointMarker>
<s3D:SpherePointMarker3D Fill="LimeGreen" Size="4.0"/>
</s3D:ImpulseRenderableSeries3D.PointMarker>
</s3D:ImpulseRenderableSeries3D>
</s3D:SciChart3DSurface.RenderableSeries>
<!-- XAxis, YAxis, ZAxis -->
<s3D:SciChart3DSurface.XAxis>
<s3D:NumericAxis3D/>
</s3D:SciChart3DSurface.XAxis>
<s3D:SciChart3DSurface.YAxis>
<s3D:NumericAxis3D/>
</s3D:SciChart3DSurface.YAxis>
<s3D:SciChart3DSurface.ZAxis>
<s3D:NumericAxis3D/>
</s3D:SciChart3DSurface.ZAxis>
</s3D:SciChart3DSurface>
// Code Behind, e.g. in OnLoaded event handler, set the DataSeries
var xyzDataSeries3D = new XyzDataSeries3D<double, double, double>();
var r = new Random();
const int Count = 15;
for (var i = 1; i < Count; i++)
{
for (var j = 1; j <= Count; j++)
{
if (i != j && i % 3 == 0 && j % 3 == 0)
{
var y = r.NextDouble();
var randomColor = Color.FromArgb(0xFF, (byte)r.Next(0, 255), (byte)r.Next(0, 255), (byte)r.Next(0, 255));
xyzDataSeries3D.Append(i, y, j, new PointMetadata3D(randomColor));
}
}
}
ImpulseRenderableSeries3D.DataSeries = xyzDataSeries3D;
Declare a 3D Stem Chart in Pure Code
// Create the SciChart3DSurface
var scs = new SciChart3DSurface
{
XAxis = new NumericAxis3D(),
YAxis = new NumericAxis3D(),
ZAxis = new NumericAxis3D()
};
// Create and assign the ImpulseRenderableSeries3D
var stemSeries3D = new ImpulseRenderableSeries3D()
{
PointMarker = new SpherePointMarker3D()
{
Fill = Colors.LimeGreen,
Size = 4.0f,
},
Stroke = Colors.LimeGreen,
StrokeThickness = 2.0f,
};
scs.RenderableSeries.Add(stemSeries3D);
// Code Behind, e.g. in OnLoaded event handler, set the DataSeries
var xyzDataSeries3D = new XyzDataSeries3D<double, double, double>();
var r = new Random();
const int Count = 15;
for (var i = 1; i < Count; i++)
{
for (var j = 1; j <= Count; j++)
{
if (i != j && i % 3 == 0 && j % 3 == 0)
{
var y = r.NextDouble();
var randomColor = Color.FromArgb(0xFF, (byte)r.Next(0, 255), (byte)r.Next(0, 255), (byte)r.Next(0, 255));
xyzDataSeries3D.Append(i, y, j, new PointMetadata3D(randomColor));
}
}
}
stemSeries3D.DataSeries = xyzDataSeries3D;
Declaring a 3D Stem Chart with Uniform Grid Data
The ImpulseRenderableSeries accepts data from the XyzDataSeries3D or UniformGridDataSeries3D. In the case of uniform data, the stem chart renders like this:
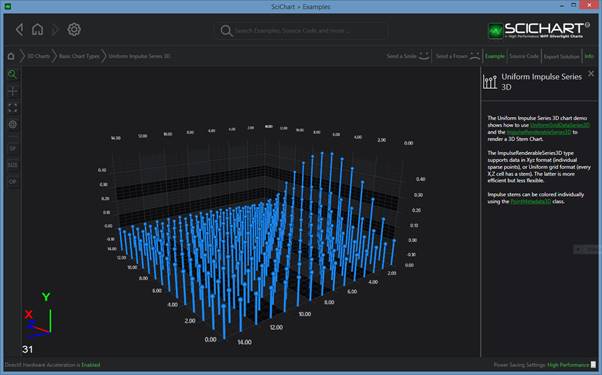
In this case the only change we make to the example is to change the data-source. Instead of XyzDataSeries3D, we use UniformGridDataSeries3D. This expects a 2D array of Y-values e.g. double[][], and has a fixed size in Z and X. Each ‘cell’ (each X-Z location) in the grid is filled with a column with height defined by the Y-value. X,Z values are computed from the UniformGridDataSeries3D.StartX, StepX, StartZ, StepZ properties.
var uniformDataSeries = new UniformGridDataSeries3D<double>(Count, Count)
{
StepX = 1, StepZ = 1
};
for (var x = 0; x < Count; x++)
{
for (var z = 0; z < Count; z++)
{
var y = Math.Sin(x * 0.25) / ((z + 1) * 2);
uniformDataSeries[x, z] = y;
}
}
ImpulseRenderableSeries3D.DataSeries = uniformDataSeries;
Point-Line 3D
Point Line Series are provided by the PointLineRenderableSeries3D type, which renders a line in 3D space with optional 3D BasePointMarker3D derived type.
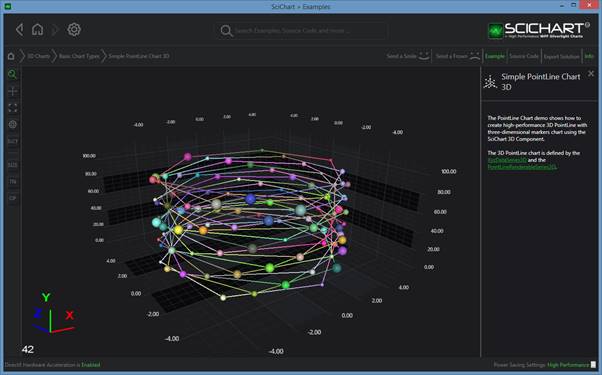
To declare a point-line using the PointLineRenderableSeries3D use the following code:
Declare a 3D Point Line in Xaml / Code Behind
<s3D:SciChart3DSurface>
<s3D:SciChart3DSurface.RenderableSeries>
<!-- Declares the ColumnRenderableSeries3D. Data is applied in code-behind -->
<s3D:PointLineRenderableSeries3D x:Name="PointLineRenderableSeries3D" Opacity="1"
Stroke="LimeGreen" StrokeThickness="1.0">
<s3D:PointLineRenderableSeries3D.PointMarker>
<s3D:SpherePointMarker3D Fill="LimeGreen" Size="2.0"/>
</s3D:PointLineRenderableSeries3D.PointMarker>
</s3D:PointLineRenderableSeries3D>
</s3D:SciChart3DSurface.RenderableSeries>
<!-- XAxis, YAxis, ZAxis -->
<s3D:SciChart3DSurface.XAxis>
<s3D:NumericAxis3D/>
</s3D:SciChart3DSurface.XAxis>
<s3D:SciChart3DSurface.YAxis>
<s3D:NumericAxis3D/>
</s3D:SciChart3DSurface.YAxis>
<s3D:SciChart3DSurface.ZAxis>
<s3D:NumericAxis3D/>
</s3D:SciChart3DSurface.ZAxis>
</s3D:SciChart3DSurface>
// Code Behind, e.g. in OnLoaded event handler, set the DataSeries
var xyzDataSeries3D = new XyzDataSeries3D<double>();
var r = new Random(0);
const int Count = 100;
for (var i = 0; i < Count; i++)
{
var x = 5 * Math.Sin(i);
var y = i;
var z = 5 * Math.Cos(i);
Color? randomColor = Color.FromArgb(0xFF, (byte)r.Next(50, 255), (byte)r.Next(50, 255), (byte)r.Next(50, 255));
var scale = (float)((r.NextDouble() + 0.5) * 3.0);
xyzDataSeries3D.Append(x, y, z, new PointMetadata3D(randomColor, scale));
}
PointLineRenderableSeries3D.DataSeries = xyzDataSeries3D;
Declare a 3D Point Cloud in Pure Code
// Create the SciChart3DSurface
var scs = new SciChart3DSurface
{
XAxis = new NumericAxis3D(),
YAxis = new NumericAxis3D(),
ZAxis = new NumericAxis3D()
};
// Create and assign the PointLineRenderableSeries3D
var pointLineSeries3D = new PointLineRenderableSeries3D()
{
PointMarker = new SpherePointMarker3D()
{
Fill = Colors.LimeGreen,
Size = 4.0f,
},
Stroke = Colors.LimeGreen,
StrokeThickness = 2.0f,
};
scs.RenderableSeries.Add(pointLineSeries3D);
// Code Behind, e.g. in OnLoaded event handler, set the DataSeries
var xyzDataSeries3D = new XyzDataSeries3D<double, double, double>();
var r = new Random();
const int Count = 15;
for (var i = 1; i < Count; i++)
{
for (var j = 1; j <= Count; j++)
{
if (i != j && i % 3 == 0 && j % 3 == 0)
{
var y = r.NextDouble();
var randomColor = Color.FromArgb(0xFF, (byte)r.Next(0, 255), (byte)r.Next(0, 255), (byte)r.Next(0, 255));
xyzDataSeries3D.Append(i, y, j, new PointMetadata3D(randomColor));
}
}
}
pointLineSeries3D.DataSeries = xyzDataSeries3D;
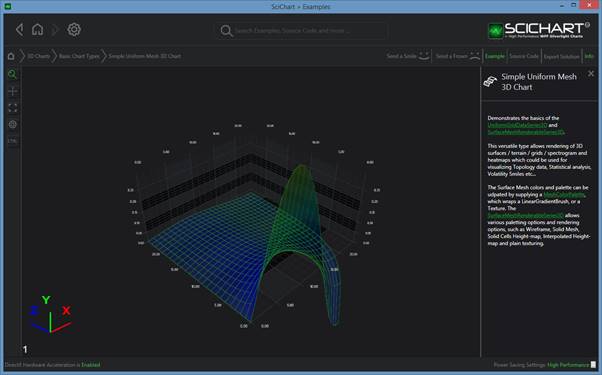
Surface Mesh 3D
Uniform Surface Mesh charts are provided by the SurfaceMeshRenderableSeries3D type, which accepts data from a UniformGridDataSeries3D in order to draw a wireframe / solid mesh with heights provided by a double[][] array of Y-values.