
Are you new to SciChart? Check out our most popular pages to get started below:
In the previous article we touched on adding a single X and Y Axis to a SciChartSurface. With SciChart you can also have unlimited left, right, top or bottom X or Y Axes. You can also place axes in the centre of the chart.
To add an axis to a chart, either in XAML, or in code:
XAML
| Adding an Axis to the SciChartSurface |
Copy Code |
|---|---|
<s:SciChartSurface> <!-- ... omitted for brevity --> <!-- Create a single X Axis --> <s:SciChartSurface.XAxis> <s:NumericAxis AxisTitle="Number of Samples (per Series)"/> </s:SciChartSurface.XAxis> <!-- Create a single Y Axis --> <s:SciChartSurface.YAxis> <s:NumericAxis AxisTitle="Value"/> </s:SciChartSurface.YAxis> </s:SciChartSurface> | |
Code
| Adding an Axis to the SciChartSurface |
Copy Code |
|---|---|
// Create the chart surface var sciChartSurface = new SciChartSurface(); // Create the X and Y Axis var xAxis = new NumericAxis() { AxisTitle = "Number of Samples (per series)"}; var yAxis = new NumericAxis() { AxisTitle = "Value"}; sciChartSurface.XAxis = xAxis; sciChartSurface.YAxis = yAxis; | |
Adding Multiple Axis
SciChart supports unlimited left, right, top or bottom axis. To add multiple axes to the chart, use the following API:
XAML
| Adding Multiple Axis |
Copy Code |
|---|---|
<!-- Create the chart surface --> <!-- where xmlns:s="http://schemas.abtsoftware.co.uk/scichart" --> <s:SciChartSurface> <!-- Create Multiple XAxis --> <s:SciChartSurface.XAxes> <s:NumericAxis AxisTitle="Primary XAxis" AxisAlignment="Bottom"/> <s:NumericAxis Id="SecondaryXAxisId" AxisTitle="Secondary XAxis" AxisAlignment="Top"/> </s:SciChartSurface.XAxes> <!-- Create Multiple YAxis --> <s:SciChartSurface.YAxes> <s:NumericAxis AxisTitle="Primary YAxis" AxisAlignment="Left"/> <s:NumericAxis Id="SecondaryYAxisId" AxisTitle="Secondary YAxis" AxisAlignment="Right"/> </s:SciChartSurface.YAxes> </s:SciChartSurface> | |
Code
| Adding Multiple Axis |
Copy Code |
|---|---|
// Create the chart surface var sciChartSurface = new SciChartSurface(); // Create the X and Y Axis var xAxis0 = new NumericAxis() { AxisTitle = "Primary XAxis", AxisAlignment=AxisAlignment.Bottom}; var xAxis1 = new NumericAxis() { AxisTitle = "Secondary XAxis", Id="SecondaryXAxisId", AxisAlignment=AxisAlignment.Top}; var yAxis0 = new NumericAxis() { AxisTitle = "Primary YAxis", AxisAlignment=AxisAlignment.Left}; var yAxis1 = new NumericAxis() { AxisTitle = "Secondary YAxis", Id="SecondaryYAxisId", AxisAlignment=AxisAlignment.Right}; sciChartSurface.XAxes.Add(xAxis0); sciChartSurface.XAxes.Add(xAxis1); sciChartSurface.YAxes.Add(yAxis0); sciChartSurface.YAxes.Add(yAxis1); | |
This declares the following SciChartSurface with multiple axis as follows:
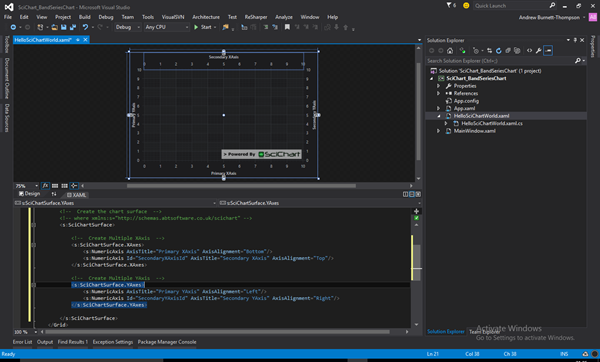
Note that each Axis has an ID property. The default ID is equal to AxisBase.DefaultAxisId = “DefaultAxisId”
NOTE: Each RenderableSeries (chart types e.g. Line, Candlestick, Column) and each Annotation (UIElements laid over the chart) and some ChartModifiers (zoom, pan behaviours) have YAxisId and XAxisId properties.
If you have only a single X and Y Axis you never have to set these ID properties. However, if you have multiple axis you will need to set these to match the IDs of the secondary axes. More on that later …