
Axis Styling - Templating the Axis Title
Templating the Axis Title
Changing Axis Title FontSize, FontFamily and Foreground
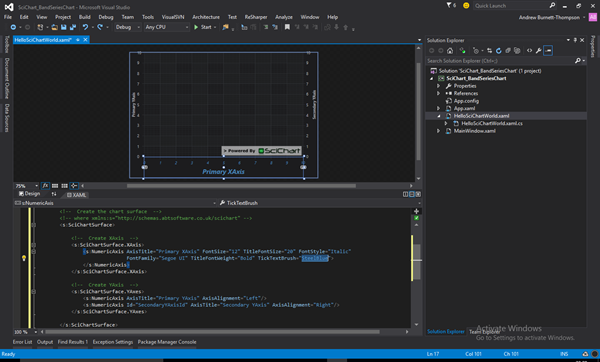
The AxisCore.AxisTitle is a string, and by default this displays a TextBlock. You can change the size of the title font using the AxisCore.TitleFontSize property. Similarly, other properties directly affect the axis title style
| Changing Axis FontSize, FontFamily and Foreground |
Copy Code |
|---|---|
<s:SciChartSurface.XAxis> <s:NumericAxis AxisTitle="Primary XAxis" FontSize="12" TitleFontSize="20" FontStyle="Italic" FontFamily="Segoe UI" TitleFontWeight="Bold" TickTextBrush="SteelBlue"> </s:NumericAxis> </s:SciChartSurface.XAxis> | |
Templating the Axis Title
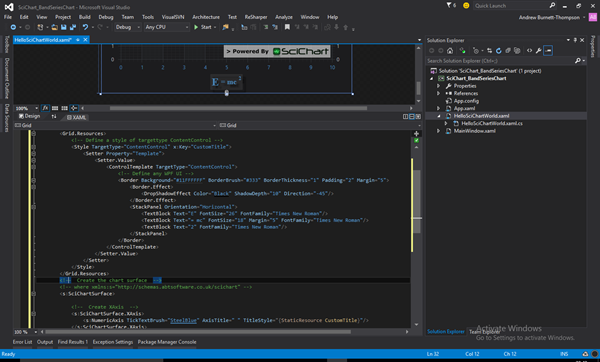
It is also possible to template the axis title, for full control over the content of the title. Any WPF UserControl can go in the title style property, which can be defined as follows:
| Templating the Axis Title |
Copy Code |
|---|---|
<Grid> <Grid.Resources> <!-- Define a style of targettype ContentControl --> <Style TargetType="ContentControl" x:Key="CustomTitle"> <Setter Property="Template"> <Setter.Value> <ControlTemplate TargetType="ContentControl"> <!-- Define any WPF UI --> <Border Background="#11FFFFFF" BorderBrush="#333" BorderThickness="1" Padding="2" Margin="5"> <Border.Effect> <DropShadowEffect Color="Black" ShadowDepth="10" Direction="-45"/> </Border.Effect> <StackPanel Orientation="Horizontal"> <TextBlock Text="E" FontSize="26" FontFamily="Times New Roman"/> <TextBlock Text="= mc" FontSize="18" Margin="5" FontFamily="Times New Roman"/> <TextBlock Text="2" FontFamily="Times New Roman"/> </StackPanel> </Border> </ControlTemplate> </Setter.Value> </Setter> </Style> </Grid.Resources> <!-- Create the chart surface --> <!-- where xmlns:s="http://schemas.abtsoftware.co.uk/scichart" --> <s:SciChartSurface> <!-- Create XAxis --> <s:SciChartSurface.XAxis> <s:NumericAxis TickTextBrush="SteelBlue" TitleStyle="{StaticResource CustomTitle}"/> </s:SciChartSurface.XAxis> <!-- Create YAxis --> <s:SciChartSurface.YAxes> <s:NumericAxis AxisTitle="Primary YAxis" AxisAlignment="Left"/> <s:NumericAxis Id="SecondaryYAxisId" AxisTitle="Secondary YAxis" AxisAlignment="Right"/> </s:SciChartSurface.YAxes> </s:SciChartSurface> </Grid> | |
See Also