
Axis.MajorDelta and MinorDelta
In SciChart, the ticks are small marks around the chart on an axis. They Also define the spacing of Gridlines, Axis Labels and Axis Bands.
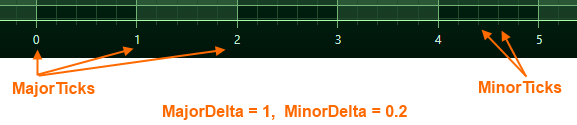
AxisBase.MajorDelta and AxisBase.MinorDelta are properties on the axis which define the delta, or difference between Major and Minor ticks. By default, the MajorDelta, MinorDelta (therefore the Tick spacing) are calculated automatically when AxisBase.AutoTicks = true.
In this mode, SciChart will calculate the Major and Minor delta suitable to render the axis according to the VisibleRange and size of the axis. As you zoom and pan, SciChart will update the MajorDelta, MinorDelta of each axis, which affects the tick frequency.
Using MaxAutoTicks, MinorsPerMajor alongside Automatic Tick Spacing
Two optional properties which are used in conjunction with AutoTicks are MaxAutoTicks and MinorsPerMajor.
When axis has AutoTicks= true it tries to generate the ticks using the following calculation:
- amount of major ticks = MaxAutoTicks;
- amount of minor ticks = MaxAutoTicks * MinorsPerMajor.
AxisBase.MaxAutoTicks is a hint to limit the number of generated ticks to the desired number and MinorsPerMajor specifies how many Minor Gridlines are drawn between Major Gridlines. The default is 5.
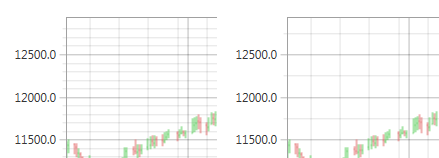
AxisBase.MinorsPerMajor = 5 (Left) vs. 2 (Right)
| Using MaxAutoTicks, MinorsPerMajor alongside Automatic Tick Spacing |
Copy Code |
|---|---|
var axis = new NumericAxis() { AutoTicks = true, MinorsPerMajor = 2, MaxAutoTicks = 5, }; | |
Setting MajorDelta, MinorDelta Manually When AxisBase.AutoTicks = False
The next mode of operation is to manually define the tick spacing. To disable automatic MajorDelta and MinorDelta calculation you should set AutoTicks = false. In this mode, SciChart requires that the developer sets the AxisBase.MajorDelta and AxisBase.MinorDelta, which will define how many tick intervals are calculated. These are absolute values and should be defined as follows:
| When AxisBase.AutoTicks = False |
Copy Code |
|---|---|
<s:NumericAxis AutoTicks="False" MajorDelta="10" MinorDelta="2"/> | |
| When AxisBase.AutoTicks = False |
Copy Code |
|---|---|
var axis = new NumericAxis() { AutoTicks = false, MajorDelta = 10, MinorDelta = 2, }; | |
When you set MajorDelta and MinorDelta you define data distance between ticks but you don’t define which values you will see on axis. So when you change visible range of axis you will probably see next:
![]()
Axis Ticks Output when Axis.AutoTicks=False and Axis.MajorDelta=25
MajorDelta, MinorDelta with the LogarithmicAxis
LogarithmicNumericAxis is a special case worth mentioning here. Due to the exponential nature of this axis type, MajorDelta represents the difference between exponents of neighbouring major ticks, not between their actual values. For instance, having MajorDelta = 3 on a LogarithmicNumericAxis with LogarithmicBase = 10 axis specifies that major ticks and gridlines will be spaced at 103 intervals (exponents will be divisors of 3):
![]()
LogarithmicNumericAxis, MajorDelta=3
On the contrary, the difference between neighbouring minor ticks is not exponential. Therefore MinorDelta represents the base difference between actual values of neighbouring minor ticks. For instance, having MinorDelta = 100 results in minor ticks and gridlines generated with the increment of 100e, where e is the exponent of the nearest major tick to the left. So the interval will be 100 between 1x100 and 1x10³, 1003 between 1x10³ and 1x10⁶, and 1006 between 1x10⁶ and 1x10⁹:
![]()
LogarithmicNumericAxis, MajorDelta=3, MinorDelta=100