Examples for the 3D Free Surface Mesh Chart can be found in the SciChart WPF Examples Suite which can be downloaded from the SciChart Website or our SciChart.WPF.Examples Github Repository.
The FreeSurfaceRenderableSeries3D type provides a number of properties that allow users to configure the chart up to their needs.
Shared Configuration with Surface Meshes
Most of the configuration options follow the same approach as it is in The SurfaceMesh 3D Chart Type so all of the following articles are also applicable to Free Surface Meshes:
- Applying Palettes to Surface Meshes
- Configuring Wireframe on the Surface Meshes
- Configuring Contours on Surface Meshes
- Overriding Specific Cell Colors
Palette Modes for Free Surface Meshes
Despite the similarity of configuration to other 3D charts, Free Surface 3D Charts have some unique options. One of them is the Palette Mode, determining which color is picked from the Palette based on its four components:
- The Axial Palette Component
- The Radial Palette Component
- The Azimuthal Palette Component
- The Polar Palette Component
Each of components can be used separately or blended together, based on values of corresponding Factor properties. Below is the formula that determines the color of the Palette:
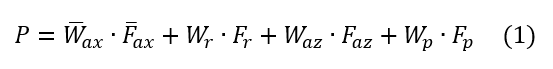
Where P is the coordinate that determines color being picked from the Palette by its value in the ange [0..1]; Wax is axial weight 3D vector and ( Fax) is axial factor 3D vector; Wr is radial weight and Fr is radial factor; Waz is azimuthal weight and Faz is azimuthal factor; Wp is polar weight and Fp is polar factor.
We will talk about each of these options below:
The Axial Palette Component
The weightof the Axial Palette Component is calculated by following formula:
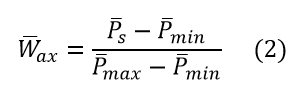
Where:
- Ps is the position of a particular point on the surface
- Pmin is specified by property FreeSurfaceRenderableSeries3D.PaletteMinimum
- Pmax is specified by property FreeSurfaceRenderableSeries3D.PaletteMaximum
The Factor of the Axial Palette Component ( see Fax on the Formula 1) is specified by property FreeSurfaceRenderableSeries3D.PaletteAxialFactor.
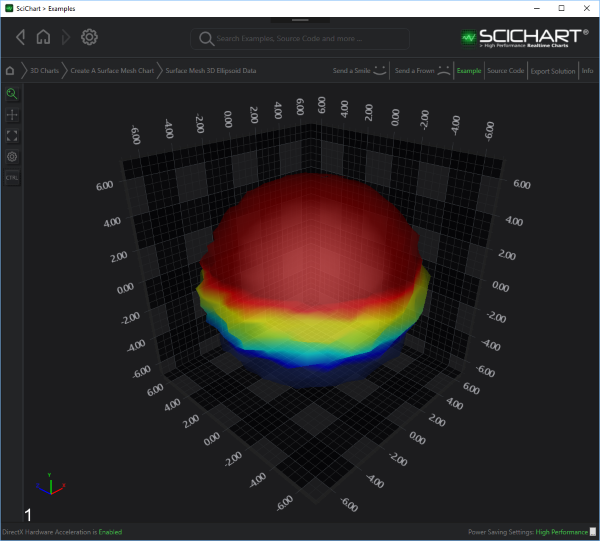
Example of The Axial Palette Component
In the following example the parameters Fax, Pmin and Pmax are set as follows:

This results in the following output:
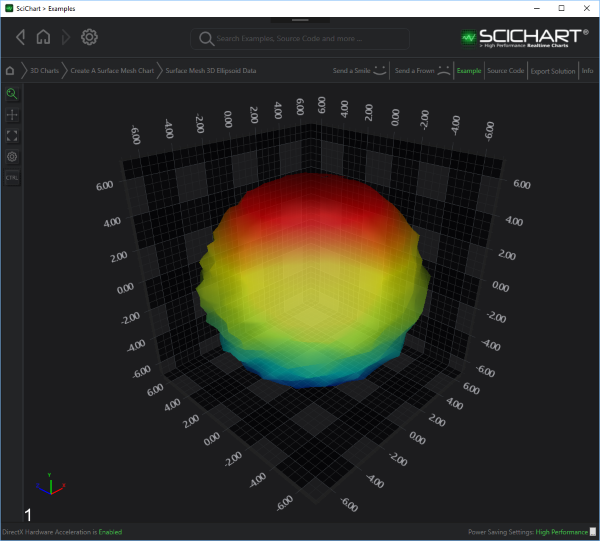
The Radial Palette Mode
In this mode palette color is determined by the distance between the chart origin and position of a particular point on the surface, linearly interpolated between the user-specified minimum and maximum values. The chart origin differs in its sense in regards to the type Free Surface Chart. For the Ellipsoid chart, the origin is defined by a point in the 3D space, whereas for the Cylindroid and Polar 3D is defined by line and plane respectively.
The weightof the Radial Palette Component is calculated by following formula:
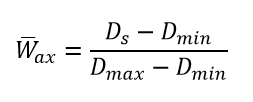
Where:
- Ds is the distance between the position of a particular point on the surface and the origin
- Dmin is the distance between Pmin and the origin. Pmin is specified by property FreeSurfaceRenderableSeries3D.PaletteMinimum
- Dmax is the distance between Pmax and the origin. Pmax is specified by property FreeSurfaceRenderableSeries3D.PaletteMaximum
The Factor of the Radial Palette Component ( see Fr on the Formula 1 ) is specified by property FreeSurfaceRenderableSeries3D.PaletteRadialFactor.
Example of The Radial Palette Component.
In the following example the parameters Fax, Pmin and Pmax are set as follows:

This results in the following output:
The Azimuthal Palette Mode
In this mode palette color is determined by cos angle between the unit vector of the X-Axis and vector from the origin point to the particular point on the surface, projected onto the XZ plane.
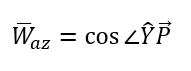
The weight of the Azimuthal Palette Component is calculated by following formula:
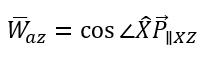
Where:
- X is the unit vector of the X-Axis
- Pxz is a particular point on the surface, projected onto the XZ plane
The Factor of the Azimuthal Palette Component ( see Fax on the Formula 1 ) is specified by property FreeSurfaceRenderableSeries3D.PaletteAzimuthalFactor.
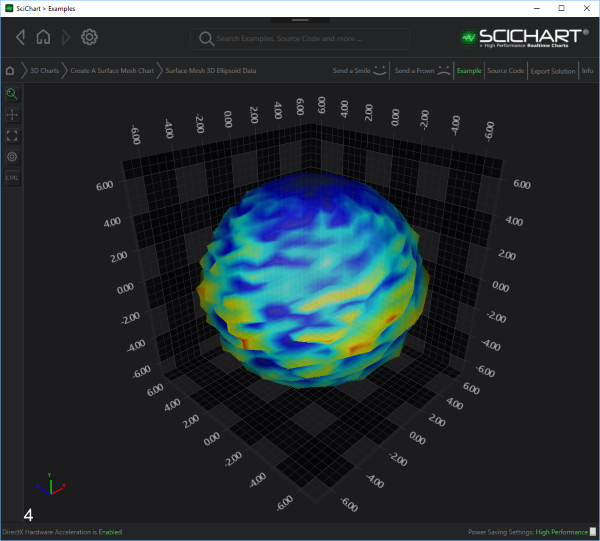
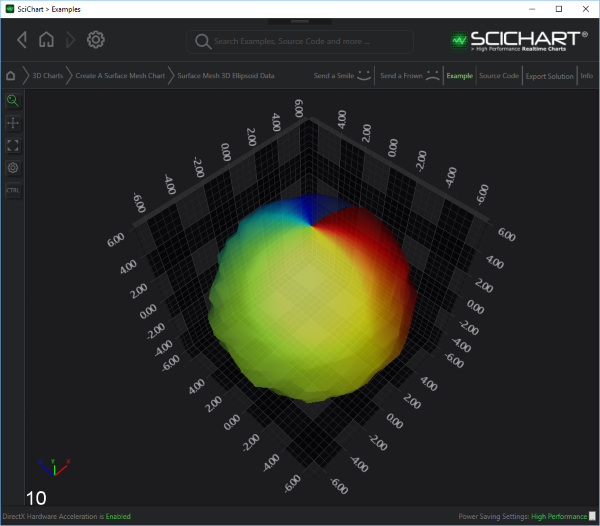
Example of The Azimuthal Palette Component.
In the following example the parameters Faz is set as follows:
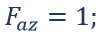
This results in the following output:
The Polar Palette Mode
In this mode, palette color is determined by cos angle between the unit vector of the Y-Axis and vector from the origin point to the particular point on the surface.
The weight of the Polar Palette Component is calculated by following formula:
Where:
- Y is the unit vector of the Y-Axis.
- P is a particular point on the surface.
The Factor of the Axial Palette Component ( see Fr on the Formula 1 ) is specified by property FreeSurfaceRenderableSeries3D.PalettePolarFactor.
Example of The PolarPalette Component.
In the following example the parameters Fp is set as follows:

This results in the following output: