
From time to time our customers report performance problems in their applications which use SciChart. Sometimes performance problems are caused by customer code, and sometimes by the configuration of SciChart, or reaching the limits of what is possible with SciChart.
Usually reported performance issues are resolved within a few days via reconfiguring the chart. Sometimes, we advise on another way to achieve the same result, or if we cannot solve the problem easily, we schedule some work in the future to focus our efforts on improving performance in that area.
Achieving the Best Performance from SciChart
To achieve the best perofrmance from SciChart it is a good first step to follow our Performance Tips and Tricks. By far the most important points are:
- To ensure data is sorted-ascending (where possible)
- To ensure DirectX renderer plugin is enabled
- To ensure data-points are appended to DataSeries in blocks
Say you've done all that and still encoutering sub-standard performance, if you have a valid support subscription, you can contact us with code or steps to reproduce the issue and we will do our best to help.
Examples where we have reconfigured the chart to get better performance
Sometimes performance can be solved just by reconfiguring how the chart is used. In this video at 42s, we managed to resolve an issue reported by a customer where a chart with 3-series of 12-million points per series went from a frozen UI (unusable) to fast & smooth updates just by reconfiguring the chart and making a few changes in user-code.
Examples where we have implemented improvements in SciChart itself to get better performance
Sometimes our customers identify a performance bottleneck which requires us to make some changes to the SciChart library itself.
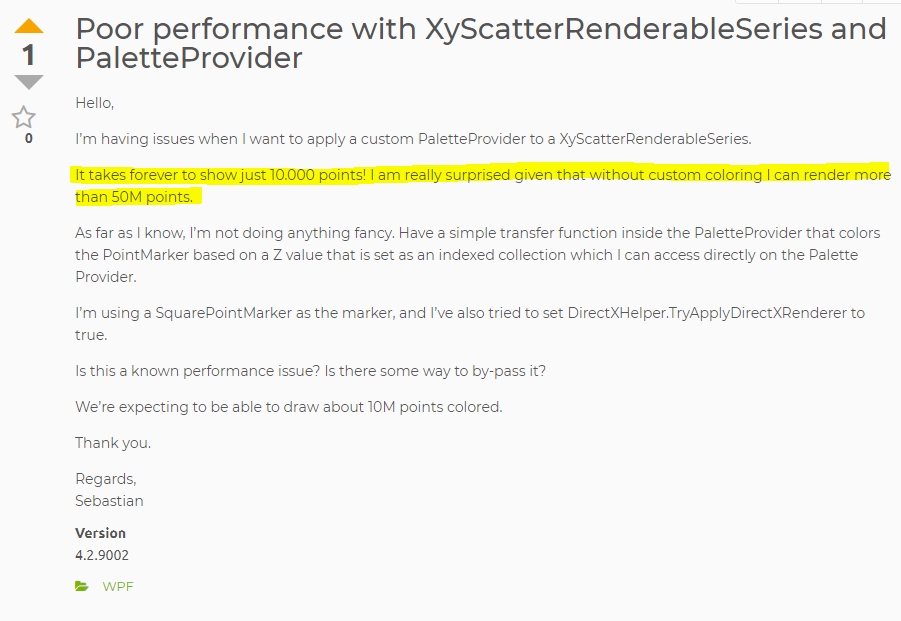
In this example, a customer reported an issue whereby using the PaletteProvider with SciChart.DirectX and scatter charts caused terrible slowdown. The customer reported that with the PaletteProvider enabled on a scatter chart, it took forever to render 10,000 points, but without paletteprovider, SciChart could easily render 50 million points.
In order to resolve this, we improved XyScatterRenderableSeries, adding support of PaletteProvider API with the hardware-accelerated renderer. This solved the problem for this type of use-case but required us to make changes in the scichart codebase to do so.
Checklist: When You discover performance problem
If you think you have a performance problem in your application, take a moment to run through this checklist before contacting support.
- Run through the Performance Tips and Tricks. Are you doing everything on that list?
- What is causing the performance issue? Take a moment to do some performance profiling with JetBrains DotTrace, or ANTS Profiler. Sometimes you can find the issue in your own code, and not in SciChart.
- Isolate code which causes or demonstrates the performance issue.
- Send this code to us (include profiling results if you have them)