SciChart allows you to synchronize multiple charts, for instance, share mouse events, share zooming, share XAxis and YAxis VisibleRange so that the charts operate in unison. This is useful for instance when you want to show multiple chart panes with a shared X-Range.
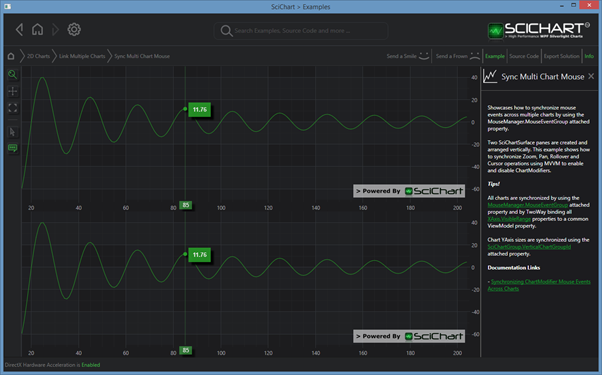
The 2D Charts > Link Multiple Charts > Sync Multi Chart Mouse example the basics of how to synchronize two charts, including mouse event, zooming and tooltip synchronization.
MouseManager.MouseEventGroup attached property
The first and foremost method to synchronize multiple charts is to use the MouseManager.MouseEventGroup attached property. The MouseEventGroup attached property is set on the root SciChartSurface.ChartModifier and is simply set to a string. You can bind to a string property in a ViewModel if you want to set MouseEventGroup in MVVM.
| Batch Add Annotations if UIElement Annotations are Slow |
Copy Code |
|---|---|
<StackPanel Orientation="Vertical"> <!-- Define Chart 0 --> <s:SciChartSurface x:Name="chart0" > <!-- XAxis, YAxis and RenderableSeries omitted for brevity --> <s:SciChartSurface.ChartModifier> <!-- Whats going on here? --> <!-- We share the mouse events by using MouseManager.MouseEventGroup="..." --> <!-- We ensure modifiers receive events even when another has handled by <!-- setting ReceiveHandledEvents=true --> <s:ModifierGroup s:MouseManager.MouseEventGroup="myCustomGroup"> <s:RubberBandXyZoomModifier ReceiveHandledEvents="True" /> <s:ZoomExtentsModifier/> </s:ModifierGroup> </s:SciChartSurface.ChartModifier> </s:SciChartSurface> <!-- Define Chart 1 --> <s:SciChartSurface x:Name="chart1" > <s:SciChartSurface.ChartModifier> <s:ModifierGroup s:MouseManager.MouseEventGroup="myCustomGroup"> <s:RubberBandXyZoomModifier ReceiveHandledEvents="True" /> <s:ZoomExtentsModifier/> </s:ModifierGroup> </s:SciChartSurface.ChartModifier> </s:SciChartSurface> </StackPanel> | |
MouseManager.MouseEventGroup ensures that when a mouse-event is fired on one SciChartSurface (e.g. MouseLeftButtonDown, MouseDoubleClick, MouseMove), that the same mouse event is fired on another SciChartSurface, with the same X,Y coordinates, the same button flags. A Master/Slave flag is also specified to tell the charts they are receiving an event from another chart.
All the ChartModifierBase derived types in SciChart override OnModifierMouseDown, OnModifierMouseMove, OnModifierMouseUp (etc…) will receive an event when the mosue is down/moved/up on another chart surface when the MouseManager.MouseEventGroup property is set.
What this means is zoom operations, tooltips and pan operations are effectively mirrored across the charts.
Sharing XAxis.VisibleRange
When you have two Charts stacked one above another, you also want to share the XAxis.VisibleRange. You can do this by
a. Binding the XAxis.VisibleRange of chart 2 to XAxis.VisibleRange of chart 1 (View only)
b. Binding the XAxis.VisibleRange of both charts to a common ViewModel property (MVVM)
Sharing XAxis.VisibleRange by binding Axis A to B
For example, using technique (a) to bind one axis to another, you would use this code
| Sharing XAxis.VisibleRange by binding Axis A to B |
Copy Code |
|---|---|
<StackPanel Orientation="Vertical"> <!-- Define Chart 0 --> <s:SciChartSurface x:Name="chart0" > <s:SciChartSurface.XAxis> <s:NumericAxis x:Name="primaryXAxis"/> </s:SciChartSurface.XAxis> <!-- YAxis, RenderableSeries, Modifiers omitted for brevity --> </s:SciChartSurface> <!-- Define Chart 1 --> <s:SciChartSurface x:Name="chart0" > <s:SciChartSurface.XAxis> <s:NumericAxis VisibleRange="{Binding ElementName=primaryXAxis, Path=VisibleRange, Mode=TwoWay}"/> </s:SciChartSurface.XAxis> <!-- YAxis, RenderableSeries, Modifiers omitted for brevity --> </s:SciChartSurface> </StackPanel> | |
Sharing XAxis.VisibleRange by binding Axis A to B in Code
The same technique can be achieved in code-behind only by using Microsoft’s syntax for binding in C# code:
| Sharing XAxis.VisibleRange by binding Axis A to B |
Copy Code |
|---|---|
// Create chart 1. YAxis and RenderableSeries omitted var chart1 = new SciChartSurface(); var primaryXAxis = new NumericAxis(); chart1.XAxis = primaryXAxis; // Create chart 2. YAxis and RenderableSeries omitted var chart2 = new SciChartSurface(); var secondaryXAxis = new NumericAxis(); chart2.XAxis = secondaryXAxis; // Bind the VisibleRange of chart2.XAxis.VisibleRange to chart1.XAxis.VisibleRange TwoWay Binding visibleRangeBinding = new Binding("VisibleRange"); visibleRangeBinding.Source = primaryXAxis; visibleRangeBinding.Mode = BindingMode.TwoWay; BindingOperations.SetBinding(secondaryXAxis, AxisBase.VisibleRangeProperty, visibleRangeBinding); | |
Sharing XAxis.VisibleRange by binding both Axis to a ViewModel Property
The same technique can be achieved in MVVM by binding both XAxis.VisibleRange to a common ViewModel property. Mutliple axis can be synchronized this way and it is the best way to keep many charts in sync.
| Sharing XAxis.VisibleRange by binding both Axis to a ViewModel Property |
Copy Code |
|---|---|
<StackPanel Orientation="Vertical"> <!-- Define Chart 0 --> <s:SciChartSurface x:Name="chart0" > <s:SciChartSurface.XAxis> <s:NumericAxis VisibleRange="{Binding SharedXRange, Mode=TwoWay}"/> </s:SciChartSurface.XAxis> <!-- YAxis, RenderableSeries, Modifiers omitted for brevity --> </s:SciChartSurface> <!-- Define Chart 1 --> <s:SciChartSurface x:Name="chart0" > <s:SciChartSurface.XAxis> <s:NumericAxis VisibleRange="{Binding SharedXRange, Mode=TwoWay}"/> </s:SciChartSurface.XAxis> <!-- YAxis, RenderableSeries, Modifiers omitted for brevity --> </s:SciChartSurface> </StackPanel> | |
| Sharing XAxis.VisibleRange by binding both Axis to a ViewModel Property |
Copy Code |
|---|---|
// Then, in the ViewModel private IRange _sharedXRange; public IRange SharedXRange { get { return _sharedXRange; } set { if (_sharedXRange != value) { _sharedXRange = value; OnPropertyChanged("SharedXRange"); } } } | |
Ensuring ChartModifiers Receive Handled Events
In the 2D Charts > Link Multiple Charts > Sync Multi Charts Mouse example, you will noticed that many of the declared ChartModifiers have ReceiveHandledEvents set to true.
| Ensuring ChartModifiers Receive Handled Events |
Copy Code |
|---|---|
<!-- Define Chart 0 --> <s:SciChartSurface x:Name="chart0" > <!-- XAxis, YAxis, RenderableSeries omitted for brevity --> <s:ModifierGroup s:MouseManager.MouseEventGroup="myCustomGroup"> <s:RubberBandXyZoomModifier IsEnabled="{Binding ZoomEnabled, Mode=TwoWay}" ReceiveHandledEvents="True" /> <s:ZoomPanModifier IsEnabled="{Binding PanEnabled, Mode=TwoWay}" ReceiveHandledEvents="True"/> <s:MouseWheelZoomModifier/> <s:RolloverModifier IsEnabled="{Binding RolloverEnabled, Mode=TwoWay}" ReceiveHandledEvents="True"/> <s:CursorModifier IsEnabled="{Binding CursorEnabled, Mode=TwoWay}" ReceiveHandledEvents="True"/> <s:YAxisDragModifier/> <s:XAxisDragModifier/> <s:ZoomExtentsModifier/> </s:ModifierGroup> </s:SciChartSurface.ChartModifier> </s:SciChartSurface> | |
The reason for this is that ChartModifiers by default mark WPF mouse events with ModifierMouseArgs.IsHandled = true, meaning the events no longer get passed to other chart modifeirs.
We override this by setting the ReceiveHandledEvents property to true. Without this, some of the modifiers will fail to work in a multiple chart scenario.
Synchronizing Axis Sizes with VerticalChartGroup
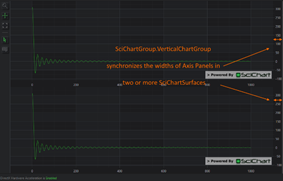 The attached property SciChartGroup.VerticalChartGroup can be optionally used to synchronize the sizes of YAxis across multiple charts. To apply this property, use the following code.
| Synchronizing Axis Sizes with VerticalChartGroup |
Copy Code |
|---|---|
<StackPanel Orientation="Horizontal"> <s:SciChartSurface s:SciChartGroup.VerticalChartGroup="MyGroup"> </s:SciChartSurface> <s:SciChartSurface s:SciChartGroup.VerticalChartGroup="MyGroup"> </s:SciChartSurface> </StackPanel> | |
Synchronizing Vertical Charts
The 2D Charts > Modify Axis Behaviour > Vertical Charts example shows you how to synchronize vertically aligned charts.
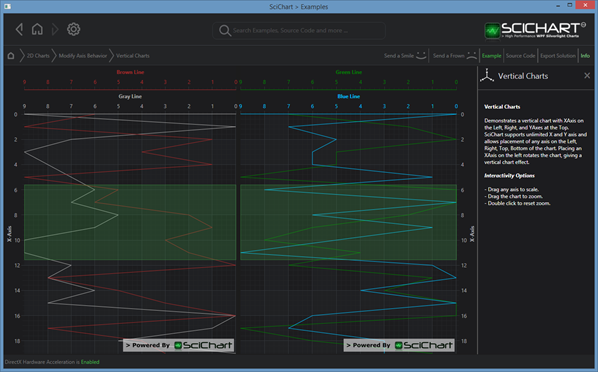
In this example we use the same technique to synchronize the two charts, namely:
a. The MouseManager.MouseEventGroup attached property is set on the ChartModifiers
b. The YAxis.VisibleRanges in this case are not bound together, but they can be to ensure synchronization of ranges.
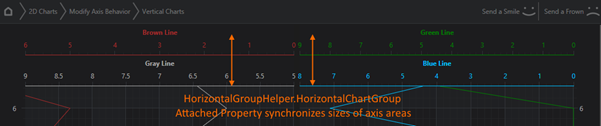
In addition, we also use the attached property HorizontalGroupHelper.HorizontalChartGroup. this synchronizes the sizes of the top Axis areas when there are two charts using the same group ID.
| Synchronizing Vertical ChartsExample Title |
Copy Code |
|---|---|
<StackPanel Orientation="Horizontal"> <s:SciChartSurface Name="sciChartLeft" s:HorizontalGroupHelper.HorizontalChartGroup="MyHorizontalGroup"> </s:SciChartSurface> <s:SciChartSurface Name="sciChartRight" s:HorizontalGroupHelper.HorizontalChartGroup="MyHorizontalGroup"> </s:SciChartSurface> </StackPanel> | |