
In response to a number of support requests regarding accuracy of Resampler Algorithms in SciChart when the data includes NaN, our team has developed a new set of C++ resampling algorithms. These are built into SciChart v5 or later and must be enabled to take advantage of them.
The performance of these resamplers is exceeds that of SciChart WPF's default c# unsafe code resamplers, and they provide far higher accuracy in some cases. This API is recommended if:
- You are using FIFO Series (Extreme Resamplers perform in-place resampling avoiding an expensive memory-copy when using FIFO charts)
- You have NaN gaps in your series
- You have unevenly spaced data in your time-series.
- You want to adjust the resolution of resampling to avoid jagged lines in the resampled series output.
- You are using the new Visual Xccelerator engine which requires the higher speed & resolution of these algorithms.
To Enable the Extreme Resamplers
Enabling the Extreme Resamplers in Code
Set the attached property PerformanceHelper.EnableExtremeResamplers to True on the SciChartSurface.
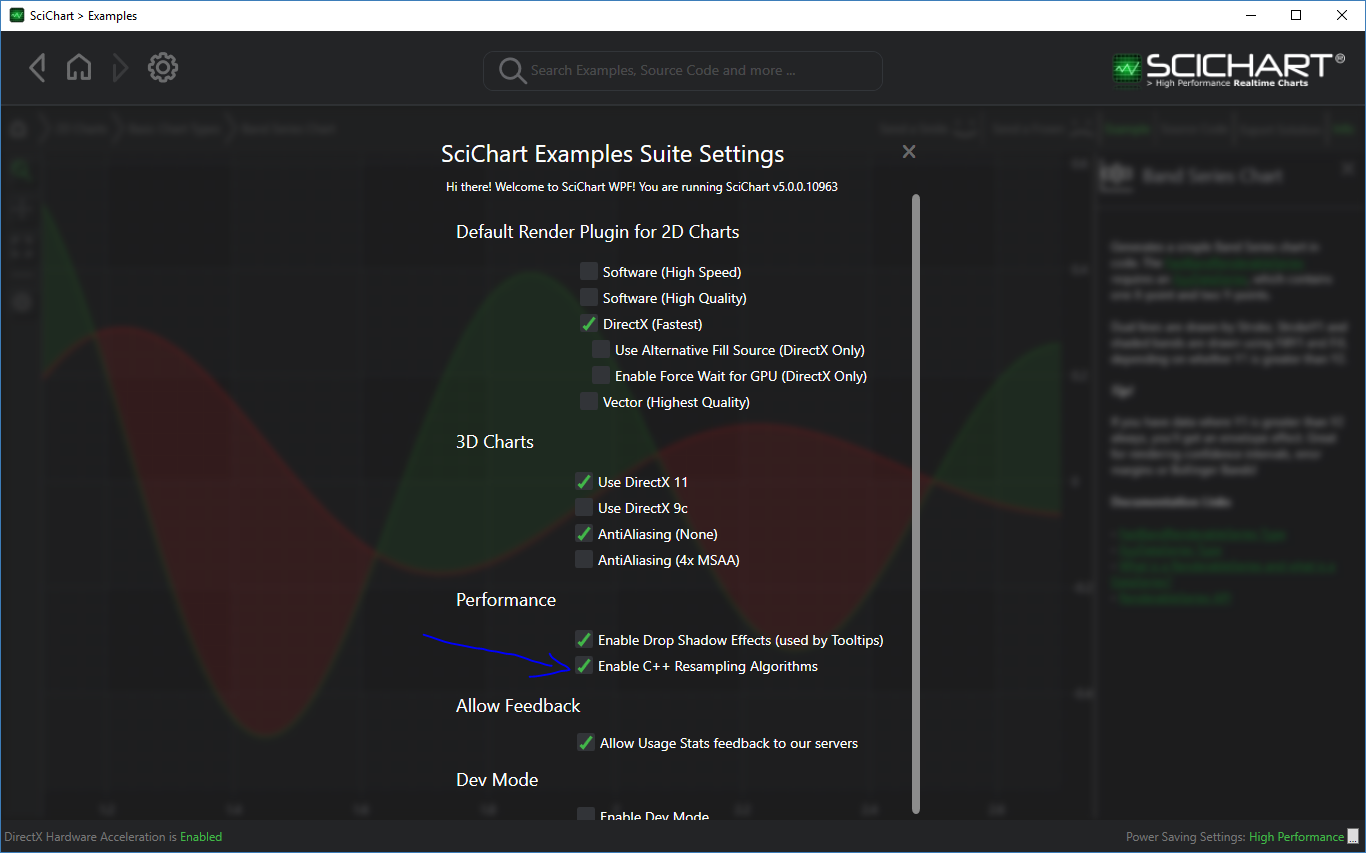
Enabling the Extreme Resamplers in the Examples App
For testing purposes you can also enable or disable this flag in the SciChart WPF Examples App. Find out how by looking at the settings dialog in the examples app below.
Adjusting Resampling Resolution
This new set of resampers also allow for changing of the precision of resampling. By default, SciChart outputs two points per pixel on the screen for time-series when downsampling data. You can change this to be 4, 8 or more for higher resolution charts.
Set the property BaseRenderableSeries.ResamplingPrecision to adjust this precision, according to the following rule.
- 0 (default value) is the default precision
- 1 means double precision
- 2 means quad precision and so on
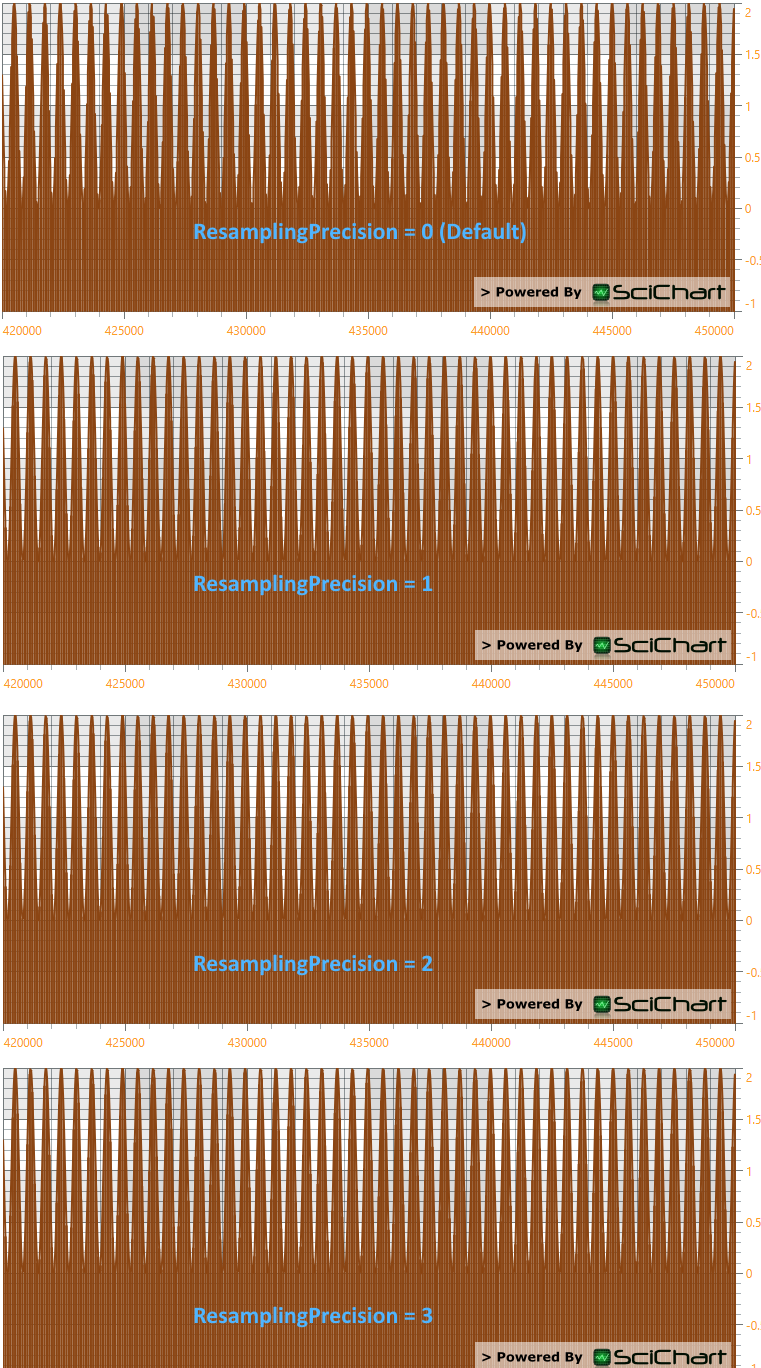
Have a look closely at the image above to see the difference. Notice that the edges of the chart when ResamplingPrecision=0 are jagged? The same edges are smooth when ResamplingPrecision is 1, 2, or 3.