The Extreme Scatter Series Type

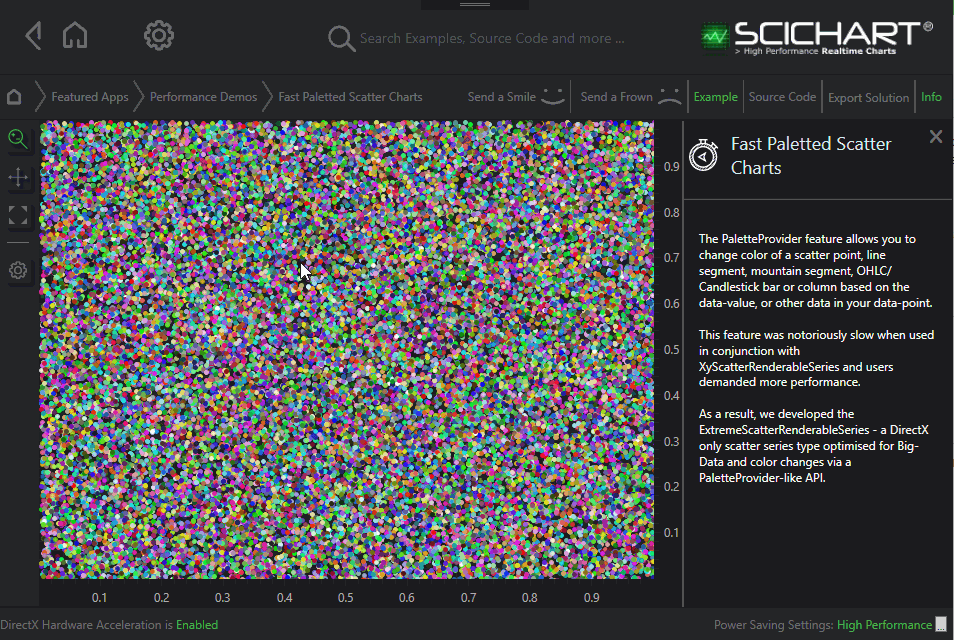
The XyScatterRenderableSeries supports the PaletteProvider for individual coloring of points, but does not handle the case of changing colors frequently very well. As a result, the ExtremeScatterRenderableSeries type was created to handle high-performance scatter charting where colours could be applied to each point individually, while maintaining extremely high performance.

Examples for the Extreme Scatter Renderable Series can be found in the SciChart WPF Examples Suite which can be downloaded from the SciChart Website or our SciChart.WPF.Examples Github Repository.

Note: The ExtremeScatterRenderableSeries only provides a performance boost when the DirectX renderer is enabled. There is no software fallback for this series type.


Declaring an ExtremeScatterRenderableSeries

Declaring an Extreme Scatter  series with XAML and Code Behind

<!-- where xmlns:s="http://schemas.abtsoftware.co.uk/scichart" -->
 <s:SciChartSurface s3D:DirectXHelper.TryApplyDirectXRenderer="True">
    <s:SciChartSurface.RenderableSeries>
        <!-- NOTE: No software fallback for this series type -->
        <s:ExtremeScatterRenderableSeries x:Name="scatterSeries">
              <!-- // NOTE: Only the Width and Height are obeyed. The color comes from the IExtremePointMarkerPaletteProvider -->
              <s:ExtremeScatterRenderableSeries.PointMarker>
                     <s:EllipsePointMarker Width="7" Height="7"/>
              </s:ExtremeScatterRenderableSeries.PointMarker>
        </s:ExtremeScatterRenderableSeries>
     </s:SciChartSurface.RenderableSeries>
    <!--  XAxis, YAxis omitted for brevity  -->
   
 </s:SciChartSurface>
// Code Behind, e.g. in OnLoaded event handler, set the DataSeries
var dataSeries = new XyDataSeries<double, double>();
for(int i = 0; i < 100; i++)
{
    dataSeries.Append(i, Math.Sin(i*0.2));
}
scatterSeries.DataSeries = dataSeries;
scatterSeries.PaletteProvider = new ExampleExtremePaletteProvider();
 
 
// Where the paletteprovider is defined as ...
public class ExampleExtremePaletteProvider : IExtremePointMarkerPaletteProvider
{
    private readonly List<Color> _dataPointColors;
    private readonly Values<Color> _colors = new Values<Color>();
    public TestPaletteProvider(List<Color> dataPointColors)
    {
        _dataPointColors = dataPointColors;
    }
    // Fill Colors for each data-point index
    public Values<Color> Colors { get { return _colors; } }
    public void OnBeginSeriesDraw(IRenderableSeries rSeries)
    {
        var indexes = rSeries.CurrentRenderPassData.PointSeries.Indexes;
        var count = indexes.Count;
        _colors.Count = count;
        // copy required colors from list using data point indices
        for (int i = 0; i < count; i++)
        {
            var dataPointIndex = indexes[i];
            _colors[i] = _dataPointColors[dataPointIndex];
        }
    }
}


Declaring an Extreme Scatter Series with pure Code

Alternatively, if you are working without XAML you can declare an ExtremeScatterRenderableSeries as follows.

// Code Behind, e.g. in OnLoaded event handler, set the DataSeries
// 1. Enable directx. No software fallback for this series type
DirectXHelper.TryApplyDirectXRenderer(sciChartSurface, true);
// 2. Declare and add series
var scatterSeries = new ExtremeScatterRenderableSeries()
{
     // NOTE: Only the Width and Height are obeyed. The color comes from the IExtremePointMarkerPaletteProvider
     EllipsePointMarker = new EllipsePointMarker() { Width = 7, Height = 7 },
}
sciChartSurface.RenderableSeries.Add(scatterSeries);
// 3. Create Data
var dataSeries = new XyDataSeries<double, double>();
for(int i = 0; i < 100; i++)
{
    dataSeries.Append(i, Math.Sin(i*0.2));
}
scatterSeries.DataSeries = dataSeries;
scatterSeries.PaletteProvider = new ExampleExtremePaletteProvider();

// 4. Where the paletteprovider is defined as ...
public class ExampleExtremePaletteProvider : IExtremePointMarkerPaletteProvider
{
     private readonly List<Color> _dataPointColors;
     private readonly Values<Color> _colors = new Values<Color>();
     public TestPaletteProvider(List<Color> dataPointColors)
     {
         _dataPointColors = dataPointColors;
     }
     // Fill Colors for each data-point index
     public Values<Color> Colors { get { return _colors; } }
     public void OnBeginSeriesDraw(IRenderableSeries rSeries)
     {
         var indexes = rSeries.CurrentRenderPassData.PointSeries.Indexes;
         var count = indexes.Count;
         _colors.Count = count;
         // copy required colors from list using data point indices
         for (int i = 0; i < count; i++)
         {
            var dataPointIndex = indexes[i];
             _colors[i] = _dataPointColors[dataPointIndex];
         }
     }
}