
The Impulse Chart Type
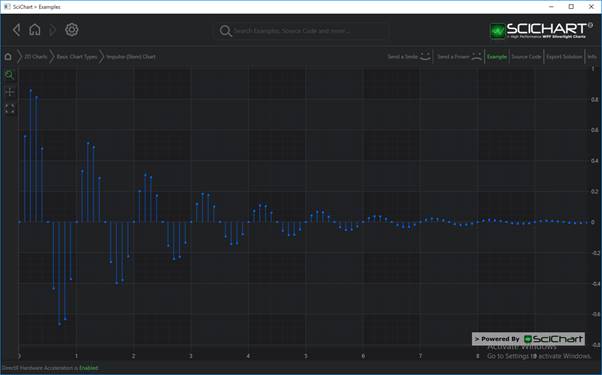
Stem charts (or Impulse Charts) are provided by the FastImpulseRenderableSeries type. This draws a single line from ZeroLineY to the X-Y value with an optional PointMarker.
Examples for the Impulse Series can be found in the SciChart WPF Examples Suite which can be downloaded from the SciChart Website or our SciChart.WPF.Examples Github Repository.
NOTE: For a detailed description of the PointMarker API, see Point Marker API-BaseRenderableSeries.Pointmarker
To declare a FastImpulseRenderableSeries use the following code:
Declare a FastImpulseRenderableSeries in Xaml / Code Behind
| Declare a FastImpulseRenderableSeries |
Copy Code |
|---|---|
<!-- where xmlns:s="http://schemas.abtsoftware.co.uk/scichart" --> <s:SciChartSurface> <s:SciChartSurface.RenderableSeries> <s:FastImpulseRenderableSeries x:Name="rSeries" AntiAliasing="True" StrokeThickness="1" Stroke="Blue" ZeroLineY="0.0"> <s:FastImpulseRenderableSeries.PointMarker> <s:EllipsePointMarker Width="7" Height="7"/> </s:FastImpulseRenderableSeries.PointMarker> </s:FastImpulseRenderableSeries> </s:SciChartSurface.RenderableSeries> <!-- XAxis, YAxis omitted for brevity --> </s:SciChartSurface> // Code Behind, e.g. in OnLoaded event handler, set the DataSeries var dataSeries = new XyDataSeries<double, double>(); for(int i = 0; i < 100; i++) dataSeries.Append(i, Math.Sin(i*0.2)); rSeries.DataSeries = dataSeries; | |
Declare a FastImpulseRenderableSeries in Pure Code
| Declare a FastImpulseRenderableSeries |
Copy Code |
|---|---|
// Declare the scichartsurface var sciChartSurface = new SciChartSurface(); // ... // Declare and add a Column Series var impulseSeries = new FastImpulseRenderableSeries() { Stroke = Colors.Blue, StrokeThickness = 2, PointMarker = new EllipsePointMarker() { Width = 7, Height = 7 }, AntiAliasing = true, ZeroLineY = 0.0, }; sciChartSurface.RenderableSeries.Add(impulseSeries); // Set some data var dataSeries = new XyDataSeries<double, double>(); for(int i = 0; i < 100; i++) dataSeries.Append(i, Math.Sin(i*0.2)); impulseSeries.DataSeries = dataSeries; | |
NOTE: You can also declare RenderableSeries using full MVVM (series ViewModels). Please see MVVM DataSeries / RenderableSeries API for more details
See Also