
In SciChart v4.2 and above, The Pie Chart type is represented by the SciChartPieSurface class.
Examples for the Pie Chart can be found in the SciChart WPF Examples Suite which can be downloaded from the SciChart Website or our SciChart.WPF.Examples Github Repository.
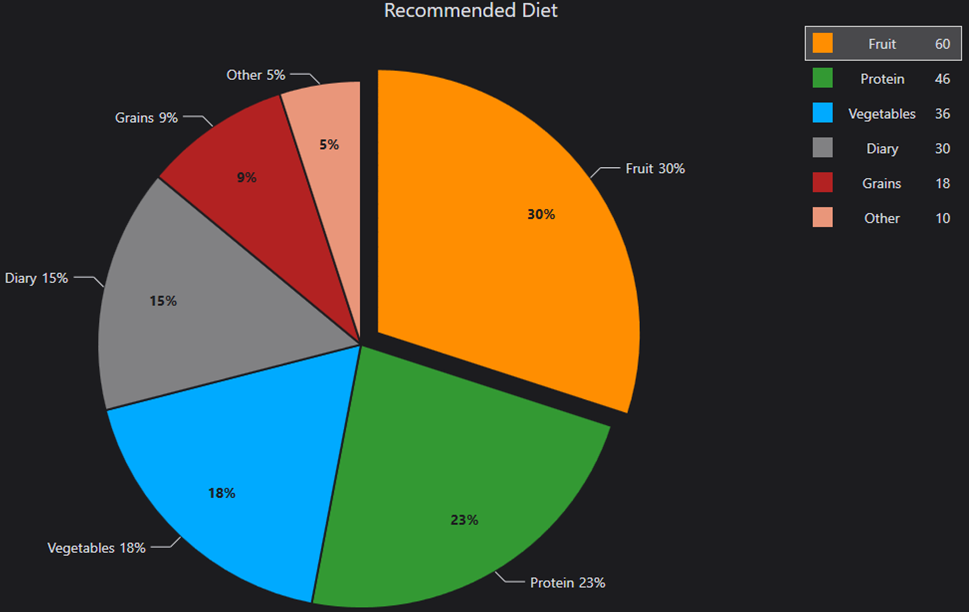
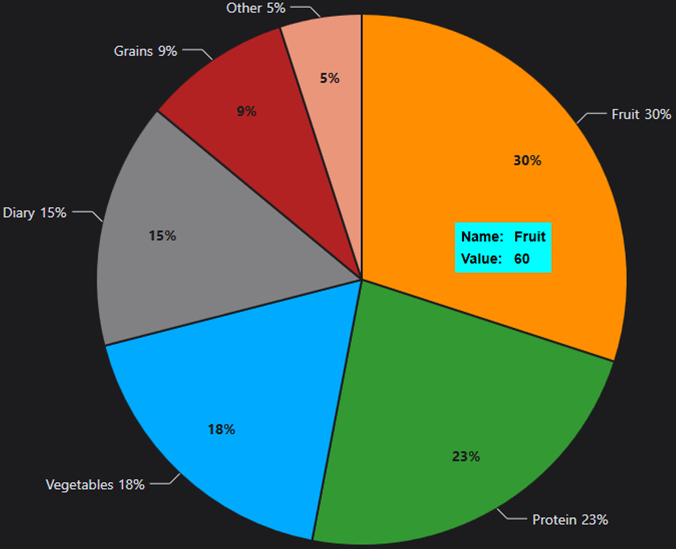
The Pie Chart represents data in a form of circle divided into triangular wedges called segments. A PieSegment represents a percentage that corresponds to a particular value. This value appears drawn on every segment and can be set either in Xaml or code. A PieSegment can be selected by clicking either on it or on the corresponding item in the Legend. This action provides a visual feedback on the chart and the Legend.
Create a Pie Chart
To create a Pie Chart, you have to provide a data source collection and assign it to the SciChartPieSurfaceBase.ItemsSource property. The data source is a collection of objects which implement the IPieSegmentViewModel interface. When creating the data source, add as many objects for as many segments you want to appear.
Creating a Pie Chart with MVVM
To create a Pie Chart in MVVM, first, create a Viewmodel for Pie Segments. Each must implement IPieSegmentViewModel, which has the following properties:
The IPieSegmentViewModel interface defines the following properties:
- Name - the name of pie segment
- Value - pie segment corresponding value. The OuterLabel is bound to it by default.
- Color - the color, which will be used as background color of the Pie segment. If not set, the color will be picked from the BrushesCollection automatically or if the BrushesCollection is empty the color will be chose randomly
- Percentage - the value which will be shown inside the Pie segment. The InnerLabel is bound to this property by default. If not set, it will be calculated automatically
- IsSelected - show if the pie segment selected.
| PieSegmentViewModel example |
Copy Code |
|---|---|
public class PieSegmentViewModel : IPieSegmentViewModel { public double Value { get; set; } public double Percentage { get; set; } public string Text { get; set; } public Brush Fill { get; set; } public bool IsSelected { get; set; } } | |
Next, declare your pie segments as follows:
| Pie Chart MVVM Example - Viewmodel |
Copy Code |
|---|---|
public class UsingPieChartExampleViewModel : BaseViewModel { public UsingPieChartExampleViewModel() { SegmentsDataCollection = new ObservableCollection<IPieSegmentViewModel> { new PieSegmentViewModel {Value = 60, Text = "Fruit" }, new PieSegmentViewModel {Value = 46, Text = "Protein"}, new PieSegmentViewModel {Value = 36, Text = "Vegetables"}, new PieSegmentViewModel {Value = 30, Text = "Diary" }, new PieSegmentViewModel {Value = 18, Text = "Grains" }, new PieSegmentViewModel {Value = 10, Text = "Other" }, }; } public ObservableCollection<IPieSegmentViewModel> SegmentsDataCollection { get; set; } } public class PieSegmentViewModel : IPieSegmentViewModel { public double Value { get; set; } public double Percentage { get; set; } public string Text { get; set; } public Brush Fill { get; set; } } | |
Finally, bind to the segments via the SciChartPieSurfaceBase.ItemsSource property.
| Pie Chart MVVM Example - XAML |
Copy Code |
|---|---|
<s:SciChartPieSurface ChartTitle="Recommended Diet" ItemsSource="{Binding SegmentsDataCollection}"> <s:SciChartPieSurface.ItemTemplate> <DataTemplate DataType="gauge:PieSegmentViewModel"> <s:PieSegment Fill="{Binding Fill}" SegmentValue="{Binding Path=Value}" Text="{Binding Path=Text}" /> </DataTemplate> </s:SciChartPieSurface.ItemTemplate> <s:SciChartPieSurface.BrushesCollection> <SolidColorBrush Color="#FF8E01" /> <SolidColorBrush Color="#339933" /> <SolidColorBrush Color="#00AAFF" /> <SolidColorBrush Color="#818183" /> <SolidColorBrush Color="Firebrick" /> <SolidColorBrush Color="DarkSalmon" /> </s:SciChartPieSurface.BrushesCollection> </s:SciChartPieSurface> | |
Creating a Pie Chart without MVVM
Alternatively, you can set the ItemSource directly in XAML or in Code behind, without a ViewModel. In this case, use the following code.
| Pie Chart - Simple XAML Example |
Copy Code |
|---|---|
<s:SciChartPieSurface.ItemsSource>
    <s:PieSegmentItem Fill="AliceBlue" Name="Text" Value="10" IsSelected="True"/>
    <s:PieSegmentItem Fill="Aqua" Name="Text1" Value="20"/>
    <s:PieSegmentItem Fill="Black" Name="Text2" Value="30"/>
    <s:PieSegmentItem Fill="Blue" Name="Text3" Value="30"/>
    <s:PieSegmentItem Fill="Coral" Name="Text4" Value="40"/>
    <s:PieSegmentItem Fill="Crimson" Name="Text5" Value="50"/>
</s:SciChartPieSurface.ItemsSource> | |
Configuring Pie Chart Segments
Multi-Select
The multi-select option is available via the SciChartPieSurfaceBase.AllowMultiSelect property. The selection of a Pie segment can be handled via the SciChartPieSurface.SelectionChanged event or the IsSelected property on IPieSegmentViewModel.
Styling Labels in Pie Segments
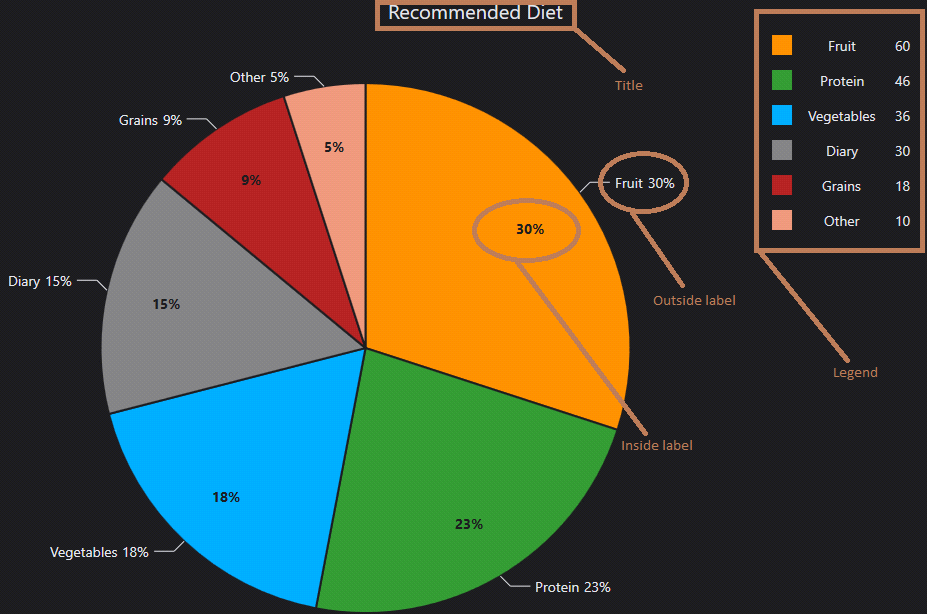
Every Pie segment can be configured to show the Outer Label and Inner Label. Their values can be provided via the corresponding properties of IPieSegmentViewModel. The Labels can be templated by using SciChartPieSurfaceBase.InsideLabelTemplate property.
| Templating the Labels in Pie Segments |
Copy Code |
|---|---|
<s:SciChartPieSurface.InsideLabelTemplate> <DataTemplate DataType="s:IPieSegmentViewModel"> <TextBlock FontSize="14" FontWeight="Bold" Foreground="#FF1C1C1F" Text="{Binding Percentage, StringFormat={}{0:#.##}%}" /> </DataTemplate> </s:SciChartPieSurface.InsideLabelTemplate> | |
Styling Labels outside of Pie Segments
The outer label can also be styled, using the SciChartPieSurfaceBase.OutsideLabelTemplate property.
The line which connects an outside label to the pie segment may be styled with the SciChartPieSurfaceBase.InfoLineStyle property.
Changing Pie Segment Colors
Colors of Pie segments can be set manually via the Color property in IPieSegmentViewModel or picked automatically from the SciChartPieSurfaceBase.BrushesCollection. This collection can be overridden with custom colors. If you don't provide colors they will be randomly created.
| Styling Pie Segment Colors |
Copy Code |
|---|---|
<s:SciChartPieSurface.BrushesCollection>
    <SolidColorBrush Color="#FF8E01" />
    <SolidColorBrush Color="#339933" />
    <SolidColorBrush Color="#00AAFF" />
    <SolidColorBrush Color="#818183" />
    <SolidColorBrush Color="Firebrick" />
    <SolidColorBrush Color="DarkSalmon" />
</s:SciChartPieSurface.BrushesCollection> | |
Configure the Legend
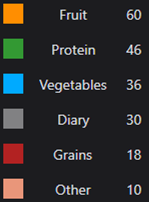
To show the Legend, set the SciChartPieSurfaceBase.ShowLegend property to True. Legend items can be re-styled via the LegendListStyle and LegendItemTemplate properties:
| Pie Chart Legend Styling Example |
Copy Code |
|---|---|
 <s:SciChartPieSurface.LegendListStyle>
     <Style TargetType="ListBox">
        <Setter Property="Foreground" Value="#FFDFE0E6" />
        <Setter Property="Background" Value="#FFDFE0E6" />
     </Style>
 </s:SciChartPieSurface.LegendListStyle>

<s:SciChartPieSurface.LegendItemTemplate>
    <DataTemplate DataType="visuals:IPieSegmentViewModel">
            <Grid HorizontalAlignment="Stretch" Margin="3">
                <Grid.ColumnDefinitions>
                    <ColumnDefinition Width="20"/>
                    <ColumnDefinition Width="100"/>
                    <ColumnDefinition/>
                </Grid.ColumnDefinitions>
                <Rectangle Grid.Column="0"
                           Width="20"
                           Height="20"
                           Fill="{Binding Fill}"/>
                <TextBlock Grid.Column="1"
                           FontSize="14"
                           TextWrapping="Wrap"
                           HorizontalAlignment="Center"
                           Margin="3"
                           Text="{Binding Name}"/>
                <TextBlock Grid.Column="2"
                           Margin="3"
                           FontSize="14"
                           VerticalAlignment="Center"
                           Text="{Binding Value}"/>
            </Grid>
    </DataTemplate>
<s:SciChartPieSurface.LegendItemTemplate> | |
Configure Cursor Tooltips
Slice tooltip by using SciChartPieSurfaceBase.ShowTooltip property. You can change style and template for tooltip by using properties SciChartPieSurfaceBase.SegmentTooltipContainerStyle and SciChartPieSurfaceBase.SegmentTooltipTemplate:
| Styling the Pie Chart Tooltips |
Copy Code |
|---|---|
<s:SciChartPieSurface.SegmentTooltipTemplate> <DataTemplate DataType="visuals:IPieSegmentViewModel"> <Grid HorizontalAlignment="Stretch" Margin="3"> <Grid.ColumnDefinitions> <ColumnDefinition /> <ColumnDefinition /> </Grid.ColumnDefinitions> <Grid.RowDefinitions> <RowDefinition/> <RowDefinition/> <RowDefinition/> </Grid.RowDefinitions> <Rectangle Width="20" HorizontalAlignment="Left" Height="20" Fill="{Binding Fill}"/> <TextBlock Grid.Column="1" Grid.Row="0" FontSize="14" HorizontalAlignment="Left" Margin="3" Text="{Binding Percentage, StringFormat={}{0} %}"/> <TextBlock Grid.Column="0" Grid.Row="1" Margin="3" FontSize="14" VerticalAlignment="Center" Text="Name: "/> <TextBlock Grid.Column="1" Grid.Row="1" Margin="3" FontSize="14" VerticalAlignment="Center" Text="{Binding Name}"/> </Grid> </DataTemplate> </s:SciChartPieSurface.SegmentTooltipTemplate> | |