
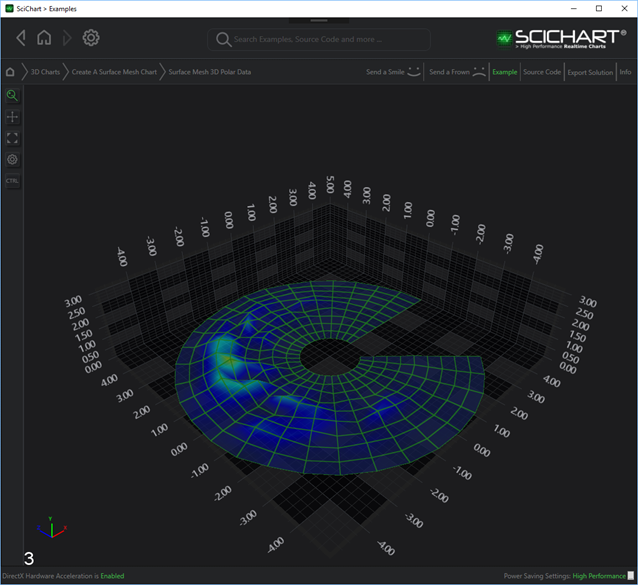
The Polar 3D Chart Type
Examples for the 3D Polar Mesh Chart can be found in the SciChart WPF Examples Suite which can be downloaded from the SciChart Website or our SciChart.WPF.Examples Github Repository.
NEW to SciChart WPF 3D v5.2!
Polar 3D Charts are provided by the PolarDataSeries3D type.
The location of the PolarDataSeries3D is defined by following properties:
- PolarDataSeries3D.OffsetX – a location of the Polar Chart by the X-Axis
- PolarDataSeries3D.OffsetY – a location of the Polar Chart by the Y-Axis
- PolarDataSeries3D.OffsetZ – a location of the Polar Chart by the Z-Axis
The size of the PolarDataSeries3D is defined by following properties:
- PolarDataSeries3D.A – a distance from the origin to the internal edge of the polar 3D Surface
- PolarDataSeries3D.B – a distance from the origin to the external edge of the polar 3D Surface
Declaring a Polar 3D Series with random values in the offset map