
Coordinate Systems
The Left Handed Coordinate System (LHS)
The SciChart3DSurface by default renders a 3D world using the Left Handed Coordinate system or LHS (as is common to DirectX). In the LHS X and Z form the horizontal plane, and Y is always up YDirection=(0,1,0). It is helpful to think of the 3D world as a 2D Chart in X-Y and Z goes ‘into the screen’.
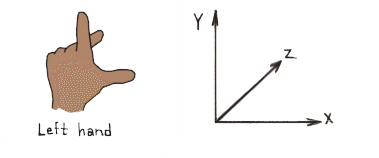
Left handed coordinate system. X-Z is a horizontal plane, Y is up.
Switching to Right Handed Coordinate System (RHS)
The SciChart3DSurface can also be rendered in the Right Handed Coordiante System (RHS) as is common to OpenGL and some CAD / Engineering packages.
To switch between the two, simply set the property SciChart3DSurface.CoordinateSystem.
| Setting SciChart3D to use Right Handed Coordinates |
Copy Code
|
|---|---|
var sciChart3DSurface = new SciChart3DSurface() { CoordinateSystem = CoordinateSystem3D.RightHanded }; |
|
World Coordinates
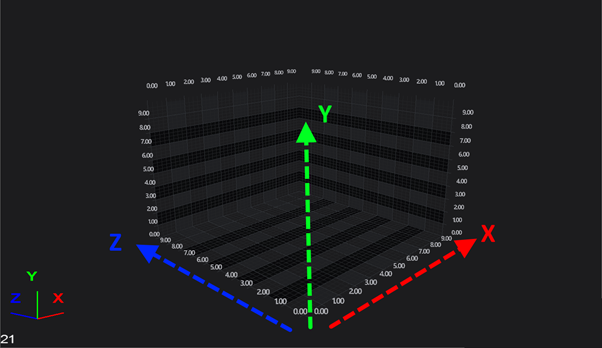
World Coordinates is the term used to describe coordinates in the 3D World. These are the raw DirectX X,Y,Z coordinates of a vertex. By default the origin (0,0,0) is in the centre, bottom of the chart.
WorldDimensions and the Axis Cube
The box in the chart is called the Axis Cube. The AxisCube size is defined by the SciChart3DSurface.WorldDimensions property.
The WorldDimensions is a single Vector3 with X,Y,Z size, but defines the size of a cube as follows:
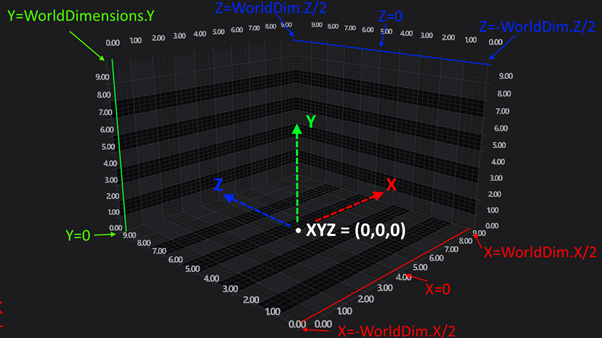
How WorldDimensions Relates to the AxisCube in SciChart3D
Therefore…
- The size of the AxisCube in the X Direction extends from -WorldDimensions.X/2 to +WorldDimensions.X/2
- The size of the AxisCube in the Y Direction extends from 0 to +WorldDimensions.Y
- The size of the AxisCube in the Z Direction extends from -WorldDimensions.Z/2 to +WorldDimensions.Z/2
NOTE: By default, SciChart3DSurface.WorldDimensions property is set to X=300, Y=200, Z=300.
Setting the WorldDimensions Property
To set the WorldDimensions Property, simply use the following code to define a Vector3 (3-component vector):
Data Coordinates
By contrast to WorldCoordinates, which are absolute coordinates in the 3D World, in SciChart 3D there is the concept of Data Coordinates.
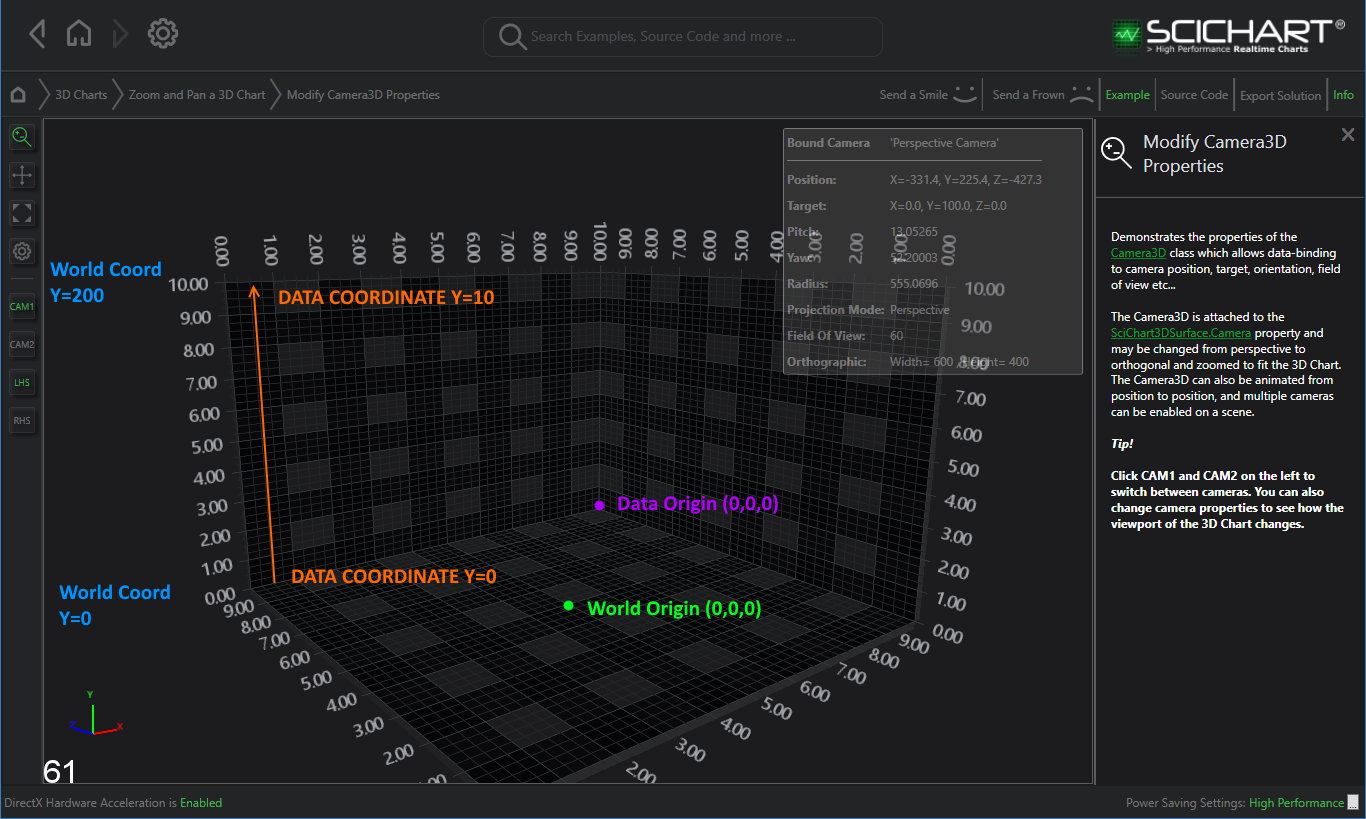
Data Coordinates are measured on an Axis, for example, the YAxis (which is UP) might have a size of 200 in the World Coordinates, but might display a VisibleRange of 0...10. Therefore, Data which falls int he range 0...10 will be spaced on this axis from 0...200 World Coordinates.
The difference between World Coordinates, Data Coordinates is shown in the following example
Converting from World to Data Coordinates
The conversion between Data Coordinates and World Coordinates is done by the Axis. For example. the follwoing code converts from Data to World Coordinates on the SciChart3DSurface.XAxis.
| Example Title |
Copy Code
|
|---|---|
// Get coordinate from a NumericAxis3D var numericAxis = new NumericAxis3D(); var coordCalc = numericAxis.GetCurrentCoordinateCalculator(); // GetCoordinate expects a double value. You can cast to double if your data is integer double worldCoord = coordCalc.GetCoordinate(1.23d); // GetDataValue converts back double dataValue = coordCald.GetDataValue(worldCoord); |
|