
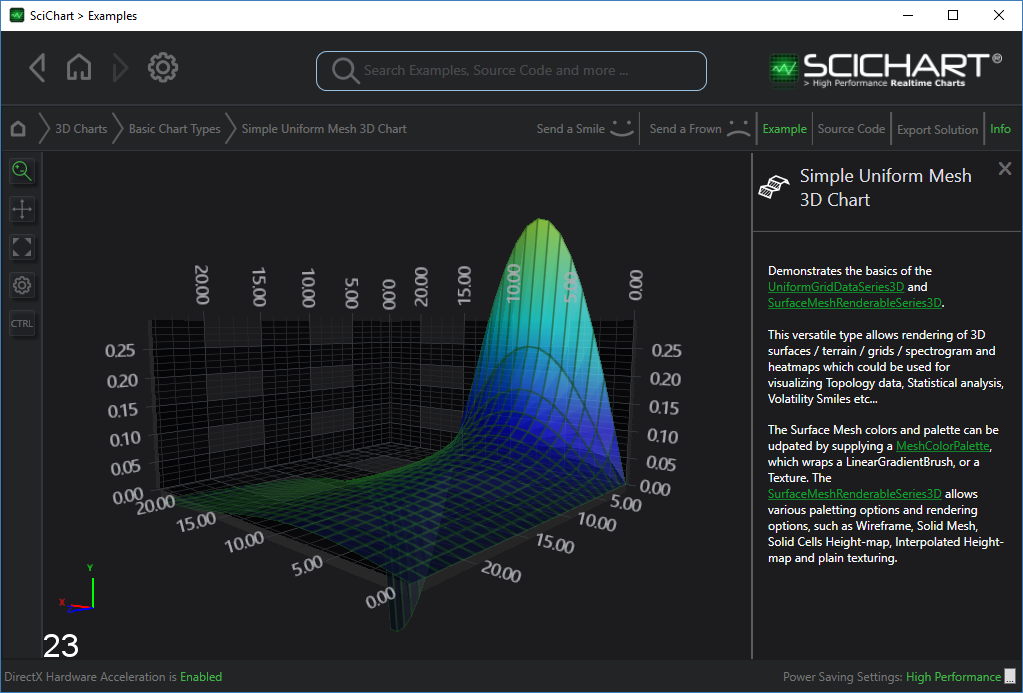
The SurfaceMesh 3D Chart Type
The surface mesh renders a two-dimensional array as a heightmap. The SurfaceMeshRenderableSeries3D type provides a number of configurable chart types in SciChart 3D, including:
- Dynamic, updating Surfaces (terrains or height maps)
- Texturing of surfaces or terrains or height maps
- Non-uniform or uniform grid spacing
- Contour mapping or wireframe on terrain or height maps
Declaring a Surface Mesh with Uniform Data
To declare a Surface Mesh with uniform data, use the following code:
Data is stored in the UniformGridDataSeries3D Type. This represents a 2-dimensional array of arrays (or 2D Jagged array) typically of type Double (but can be defined with generics).
Some important points to note:
- The double values stored in the UniformGridDataSeries3D correspond to the heights on the chart (the Y-Axis). They are transformed into chart World Coordinates via the SciChart3DSurface.YAxis.
- The Z and X Data-Value is defined by the StartX, StepX, StartZ and StepZ properties on UniformGridDataSeries3D. These are also transformed into World Coordinates via the SciChart3DSurface.ZAxis and XAxis respectively.
- The Colours on the SurfaceMesh are defined by the MeshColorPalette. More on this in the following sections.
See Also