Tutorial 03b - Adding Series to a Chart with MVVM
Source code for this tutorial can be found at our SciChart.WPF.Examples Github Repository under Tutorials section.
Following on from Tutorial 02b - Creating a SciChartSurface with MVVM where we created the chart control, added an XAxis and a YAxis, we will now add a some Series with some data to the chart.
Adding a Series in MVVM
In order to add a Series to our Chart, we need to declare some RenderableSeries in our viewmodel. We adjust the viewmodel code as follows:
| MainViewModel |
Copy Code |
|---|---|
using System.Collections.ObjectModel; using System.Windows.Media; using SciChart.Charting.Model.ChartSeries; using SciChart.Charting.Model.DataSeries; using SciChart.Data.Model; namespace SciChart.Mvvm.Tutorial { public class MainViewModel : BindableObject { private string _chartTitle = "Hello SciChart World!"; private string _xAxisTitle = "XAxis"; private string _yAxisTitle = "YAxis"; private ObservableCollection<IRenderableSeriesViewModel> _renderableSeries; public MainViewModel() { var lineData = new XyDataSeries<double, double>() { SeriesName = "TestingSeries" }; lineData.Append(0, 0); lineData.Append(1, 1); lineData.Append(2, 2); _renderableSeries = new ObservableCollection<IRenderableSeriesViewModel>(); RenderableSeries.Add(new LineRenderableSeriesViewModel() { StrokeThickness = 2, Stroke = Colors.SteelBlue, DataSeries = lineData, }); } public ObservableCollection<IRenderableSeriesViewModel> RenderableSeries { get { return _renderableSeries; } set { _renderableSeries = value; OnPropertyChanged("RenderableSeries"); } } public string ChartTitle { get { return _chartTitle; } set { _chartTitle = value; OnPropertyChanged("ChartTitle"); } } public string XAxisTitle { get { return _xAxisTitle; } set { _xAxisTitle = value; OnPropertyChanged("XAxisTitle"); } } public string YAxisTitle { get { return _yAxisTitle; } set { _yAxisTitle = value; OnPropertyChanged("YAxisTitle"); } } } } | |
What have we done here?
We've exposed a property of type ObservableCollection<IRenderableSeriesViewModel>. This is going to be used to show our series on the chart using our SeriesBinding MVVM API.
In MainView, lets add some XAML to bind to the MainViewModel.ChartViewModel collection and show some charts!
| MainWindow.xaml after binding to RenderableSeries |
Copy Code |
|---|---|
<Window x:Class="SciChart.Mvvm.Tutorial.MainWindow" xmlns="http://schemas.microsoft.com/winfx/2006/xaml/presentation" xmlns:x="http://schemas.microsoft.com/winfx/2006/xaml" xmlns:d="http://schemas.microsoft.com/expression/blend/2008" xmlns:mc="http://schemas.openxmlformats.org/markup-compatibility/2006" xmlns:local="clr-namespace:SciChart.Mvvm.Tutorial" xmlns:s="http://schemas.abtsoftware.co.uk/scichart" mc:Ignorable="d" Title="MainWindow" Height="550" Width="800"> <Window.Resources> <local:MainViewModel x:Key="MainViewModel"/> </Window.Resources> <Grid DataContext="{StaticResource MainViewModel}"> <!-- Bind to ChartViewModel.RenderableSeries collection using SeriesBinding --> <s:SciChartSurface RenderableSeries="{s:SeriesBinding RenderableSeries}" ChartTitle="{Binding ChartTitle}"> <s:SciChartSurface.XAxis> <s:NumericAxis AxisTitle="{Binding XAxisTitle}"/> </s:SciChartSurface.XAxis> <s:SciChartSurface.YAxis> <s:NumericAxis AxisTitle="{Binding YAxisTitle}"/> </s:SciChartSurface.YAxis> </s:SciChartSurface> </Grid> </Window> | |
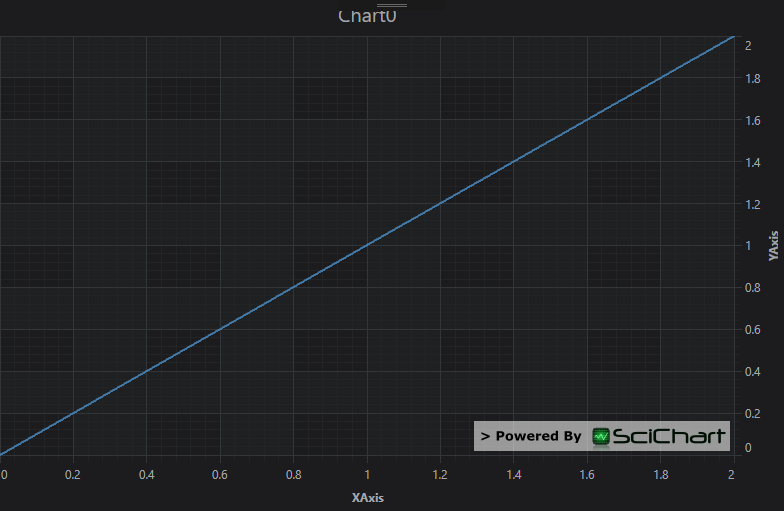
Now run the application so far. This is what you should see: