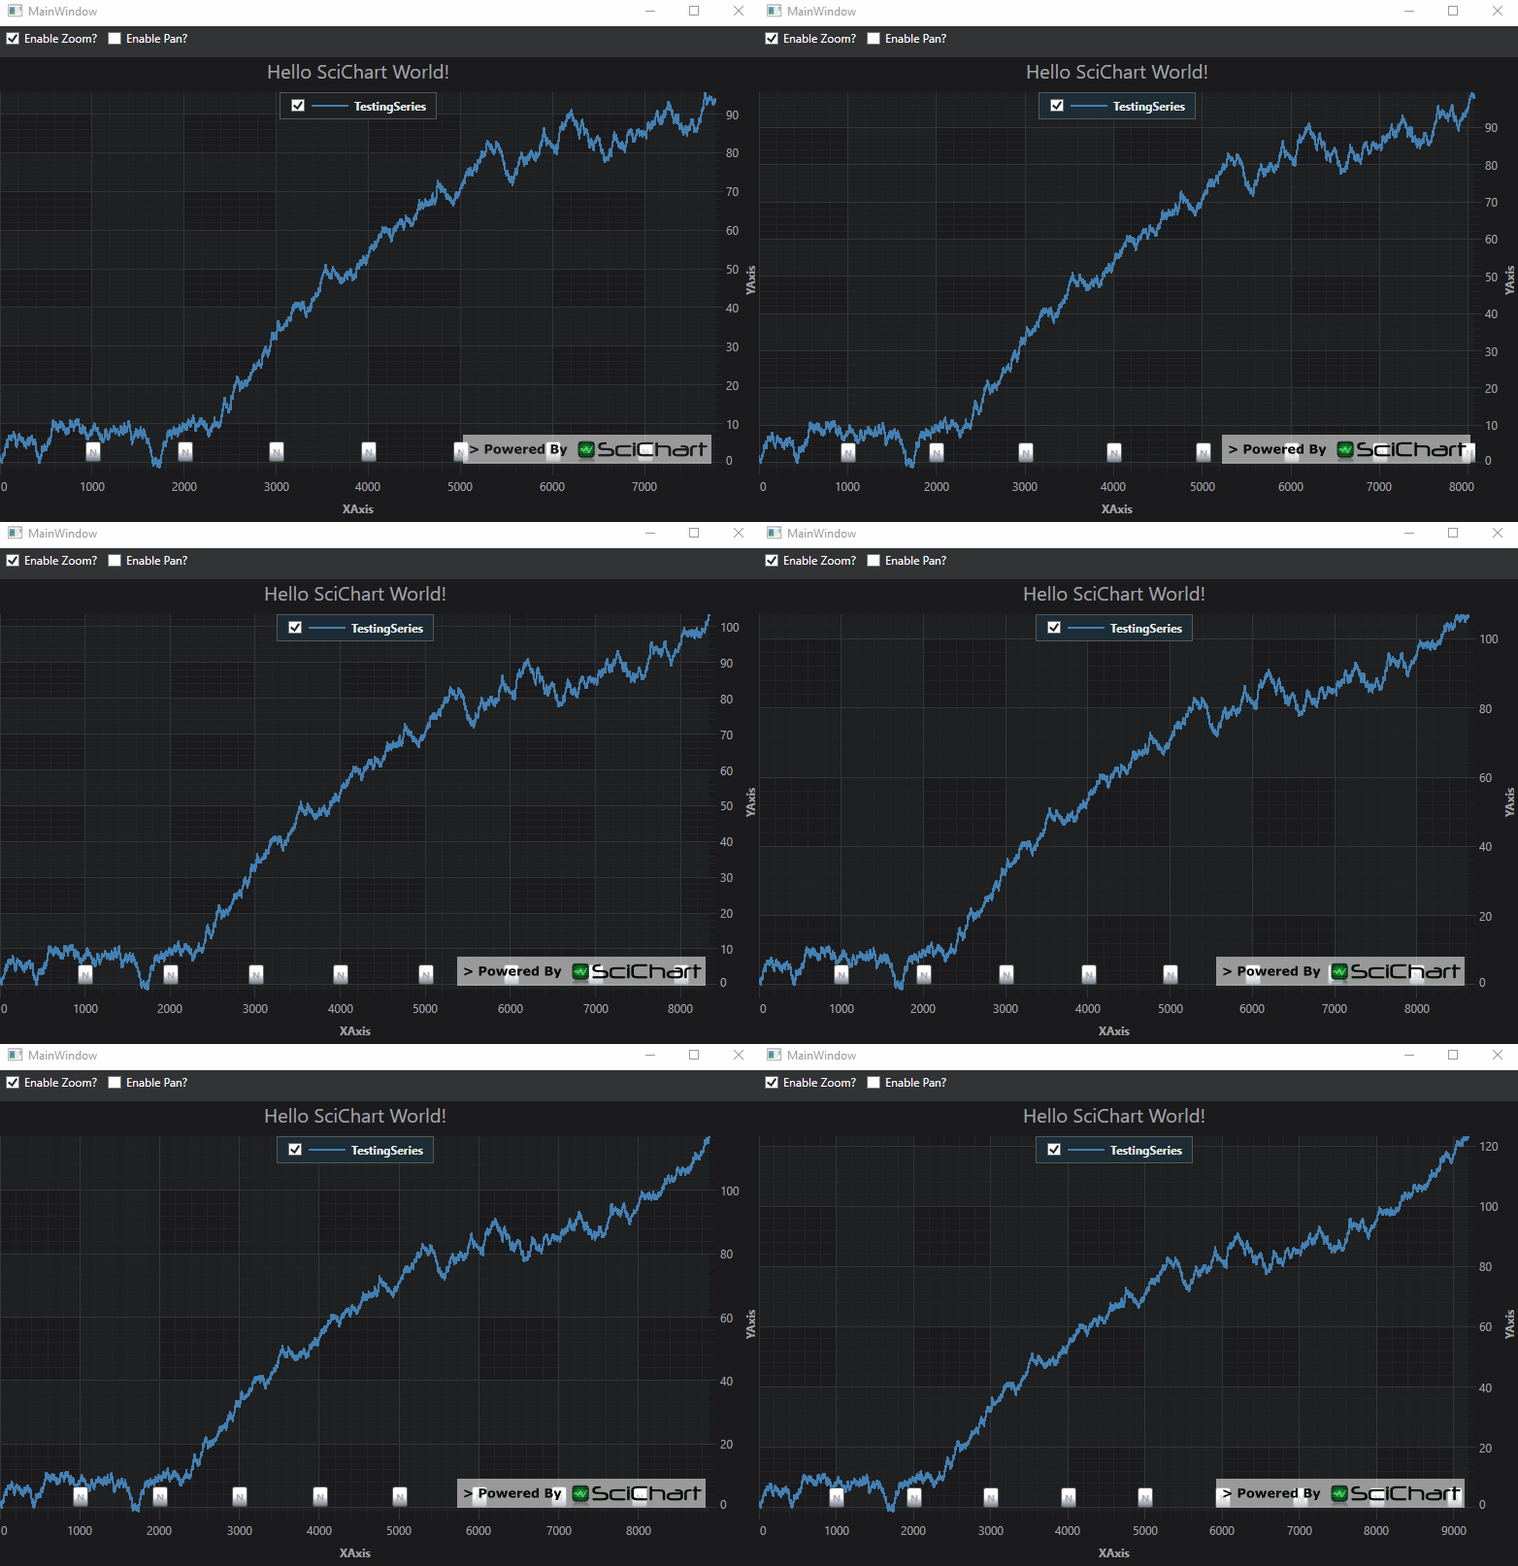
Tutorial 07b - Adding Annotations with MVVM
Adding Annotations in MVVM
Source code for this tutorial can be found at our SciChart.WPF.Examples Github Repository under Tutorials section.
We want to now add some Annotations in MVVM. To do this, lets create first our Annotation type, taken from Tutorial 07 - Adding Annotations.
| InfoAnnotation.Xaml |
Copy Code |
|---|---|
<s:CustomAnnotationForMvvm x:Class="SciChart.Mvvm.Tutorial.InfoAnnotation" xmlns="http://schemas.microsoft.com/winfx/2006/xaml/presentation" xmlns:x="http://schemas.microsoft.com/winfx/2006/xaml" xmlns:s="http://schemas.abtsoftware.co.uk/scichart"> <s:CustomAnnotationForMvvm.Resources> <LinearGradientBrush x:Key="infoAnnotationBackground" StartPoint="0,0" EndPoint="0,1"> <GradientStop Offset="0.5" Color="#FFF" /> <GradientStop Offset="1" Color="#77C0D4EE" /> </LinearGradientBrush> </s:CustomAnnotationForMvvm.Resources> <Grid> <!-- Low-cost drop shadow --> <Border CornerRadius="2" BorderThickness="1" BorderBrush="#333" Background="#333" Opacity="0.8" Margin="2,2,0,0"/> <!-- News bullet body --> <Border CornerRadius="2" BorderThickness="1" BorderBrush="#555" Background="{StaticResource infoAnnotationBackground}"> <TextBlock Text="N" Padding="3" FontWeight="Bold" FontSize="10"/> </Border> <!-- Creating the tooltip. In the TradeOverlayExampleViewModel we set a News object as datacontext of this annotation --> <ToolTipService.ToolTip> <ToolTip Foreground="#222"> <Grid Margin="6" MaxHeight="100" MaxWidth="150"> <TextBlock Text="Show more info here!" Foreground="#3333FF"/> </Grid> </ToolTip> </ToolTipService.ToolTip> </Grid> </s:CustomAnnotationForMvvm> | |
| InfoAnnotation.xaml.cs |
Copy Code |
|---|---|
using SciChart.Charting.Visuals.Annotations; namespace SciChart.Mvvm.Tutorial { public partial class InfoAnnotation : CustomAnnotationForMvvm { public InfoAnnotation() { InitializeComponent(); } } } | |
We also need a ViewModel for the custom annotation. We base this off CustomAnnotationViewModel as follows:
| InfoAnnotationViewModel |
Copy Code |
|---|---|
using System; using SciChart.Charting.Model.ChartSeries; namespace SciChart.Mvvm.Tutorial { public class InfoAnnotationViewModel : CustomAnnotationViewModel { public override Type ViewType { get { return typeof(InfoAnnotation); } } } } | |
Now to add these to our charts using MVVM. We can't access the SciChartSurface.Annotations property, as this is on the SciChartSurface which is a view item, and cannot (should not) be accessed from the ViewModel.
Instead we're going to use the AnnotationsBinding MarkupExtension to add these to the chart.
Dynamically Adding Annotations in the ViewModel
In order to add Annotations in the ViewModel, we need to do a few things:
- Declare a collection of IAnnotationViewModel, similar to the RenderableSeries collection.
- Add our InfoAnnotationViewModel to this collection with X1,Y1 values to tag them onto the chart.
- In the view, we need to include a default style for InfoAnnotation to inherit from one of our built-in styles. This ensures that X1,X2 and other default properties are bound.
Let's do this below:
| MainViewModel |
Copy Code |
|---|---|
public class MainViewModel : BindableObject { private string _chartTitle = "Hello SciChart World!"; private string _xAxisTitle = "XAxis"; private string _yAxisTitle = "YAxis"; private bool _enablePan; private bool _enableZoom = true; private XyDataSeries<double, double> _lineData; private readonly DummyDataProvider _dummyDataProvider = new DummyDataProvider(); private AutoRangeViewportManager _viewportManager = new AutoRangeViewportManager(); private ObservableCollection<IAnnotationViewModel> _annotations = new ObservableCollection<IAnnotationViewModel>(); private ObservableCollection<IRenderableSeriesViewModel> _renderableSeries = new ObservableCollection<IRenderableSeriesViewModel>(); public MainViewModel() { CreateChartData(); CreateChartSeries(); // Subscribe to future updates int i = 0; _dummyDataProvider.SubscribeUpdates(newValues => { // Append when new values arrive _lineData.Append(newValues.XValues, newValues.YValues); // Every 100th data point, add an annotation if (i % 100 == 0) { Annotations.Add(new InfoAnnotationViewModel { X1 = _lineData.XValues.Last(), Y1 = 0.0, // Specify that the point (X1, Y1) is located at the bottom-center of the annotation VerticalAnchorPoint=VerticalAnchorPoint.Bottom, HorizontalAnchorPoint=HorizontalAnchorPoint.Center, }); } i++; }); } private void CreateChartData() { var initialDataValues = _dummyDataProvider.GetHistoricalData(); // Create a DataSeries. We later apply this to a RenderableSeries _lineData = new XyDataSeries<double, double> { SeriesName = "TestingSeries" }; // Append some data to the chart _lineData.Append(initialDataValues.XValues, initialDataValues.YValues); } private void CreateChartSeries() { // Create a RenderableSeries. Apply the DataSeries created before _renderableSeries = new ObservableCollection<IRenderableSeriesViewModel>(); RenderableSeries.Add(new LineRenderableSeriesViewModel { StrokeThickness = 2, Stroke = Colors.SteelBlue, DataSeries = _lineData, StyleKey = "LineSeriesStyle" }); } public ObservableCollection<IAnnotationViewModel> Annotations { get { return _annotations; } set { _annotations = value; OnPropertyChanged("Annotations"); } } public ObservableCollection<IRenderableSeriesViewModel> RenderableSeries { get { return _renderableSeries; } set { _renderableSeries = value; OnPropertyChanged("RenderableSeries"); } } public AutoRangeViewportManager ViewportManager { get { return _viewportManager; } set { _viewportManager = value; OnPropertyChanged("ViewportManager"); } } // ... ChartTitle, XAxisTitle, YAxisTitle, EnableZoom, EnablePan omitted for brevity ... } | |
We need to update our view code as well.
- Ensure that all the resources in MainWindow.xaml are included in a resource dictionary.
- Include the default.xaml styles from SciChart. We need this for our base styule for CustomAnnotation
- Include a style for InfoAnnotation. We need this to ensure default properties such as X1,Y1 are data-bound.
| MainWindow.xaml |
Copy Code |
|---|---|
<Window.Resources> <ResourceDictionary> <local:MainViewModel x:Key="MainViewModel"/> <!-- The TooltipControl template is defined below --> <!-- Change this if you want to have a non-default tooltip container --> <!-- The ContentPresenter is bound to the DataContext (a SeriesInfo type) --> <!-- and the ContentTemplate is the DataTemplate for the SeriesInfo --> <!-- Finally, the TooltipContainerStyle is set on the RenderableSeries via Style --> <Style x:Key="TooltipContainer" TargetType="s:TooltipControl"> <Setter Property="Template"> <Setter.Value> <ControlTemplate TargetType="s:TooltipControl"> <Border Background="#FF6495ED" BorderBrush="#FF87B1FA" BorderThickness="2" CornerRadius="5" Opacity="0.9" Padding="5"> <ContentPresenter Content="{TemplateBinding DataContext}" ContentTemplate="{TemplateBinding ContentTemplate}"/> </Border> </ControlTemplate> </Setter.Value> </Setter> </Style> <!-- Tooltip Template for an XyDataSeries binds to XySeriesInfo --> <!-- Check out the properties on XySeriesInfo to see what you can bind to --> <DataTemplate x:Key="TooltipTemplate" DataType="s:XySeriesInfo"> <StackPanel Orientation="Vertical"> <TextBlock Foreground="White" Text="{Binding SeriesName, Mode=OneWay, StringFormat='Series: {0}'}"/> <TextBlock Foreground="White" Text="{Binding FormattedXValue, Mode=OneWay, StringFormat='X-Value: {0}'}"/> <TextBlock Foreground="White" Text="{Binding FormattedYValue, Mode=OneWay, StringFormat='Y-Value: {0}'}"/> </StackPanel> </DataTemplate> <!-- Style applied via x:Key name in ViewModel. See StyleKey property of LineRenderableSeriesViewModel --> <Style x:Key="LineSeriesStyle" TargetType="s:BaseRenderableSeries"> <Setter Property="s:RolloverModifier.TooltipContainerStyle" Value="{StaticResource TooltipContainer}"/> <Setter Property="s:RolloverModifier.TooltipTemplate" Value="{StaticResource TooltipTemplate}"/> <Setter Property="s:RolloverModifier.IncludeSeries" Value="True"/> <Setter Property="StrokeThickness" Value="2"/> </Style> </ResourceDictionary> </Window.Resources> | |
Running the code, we now see this:

