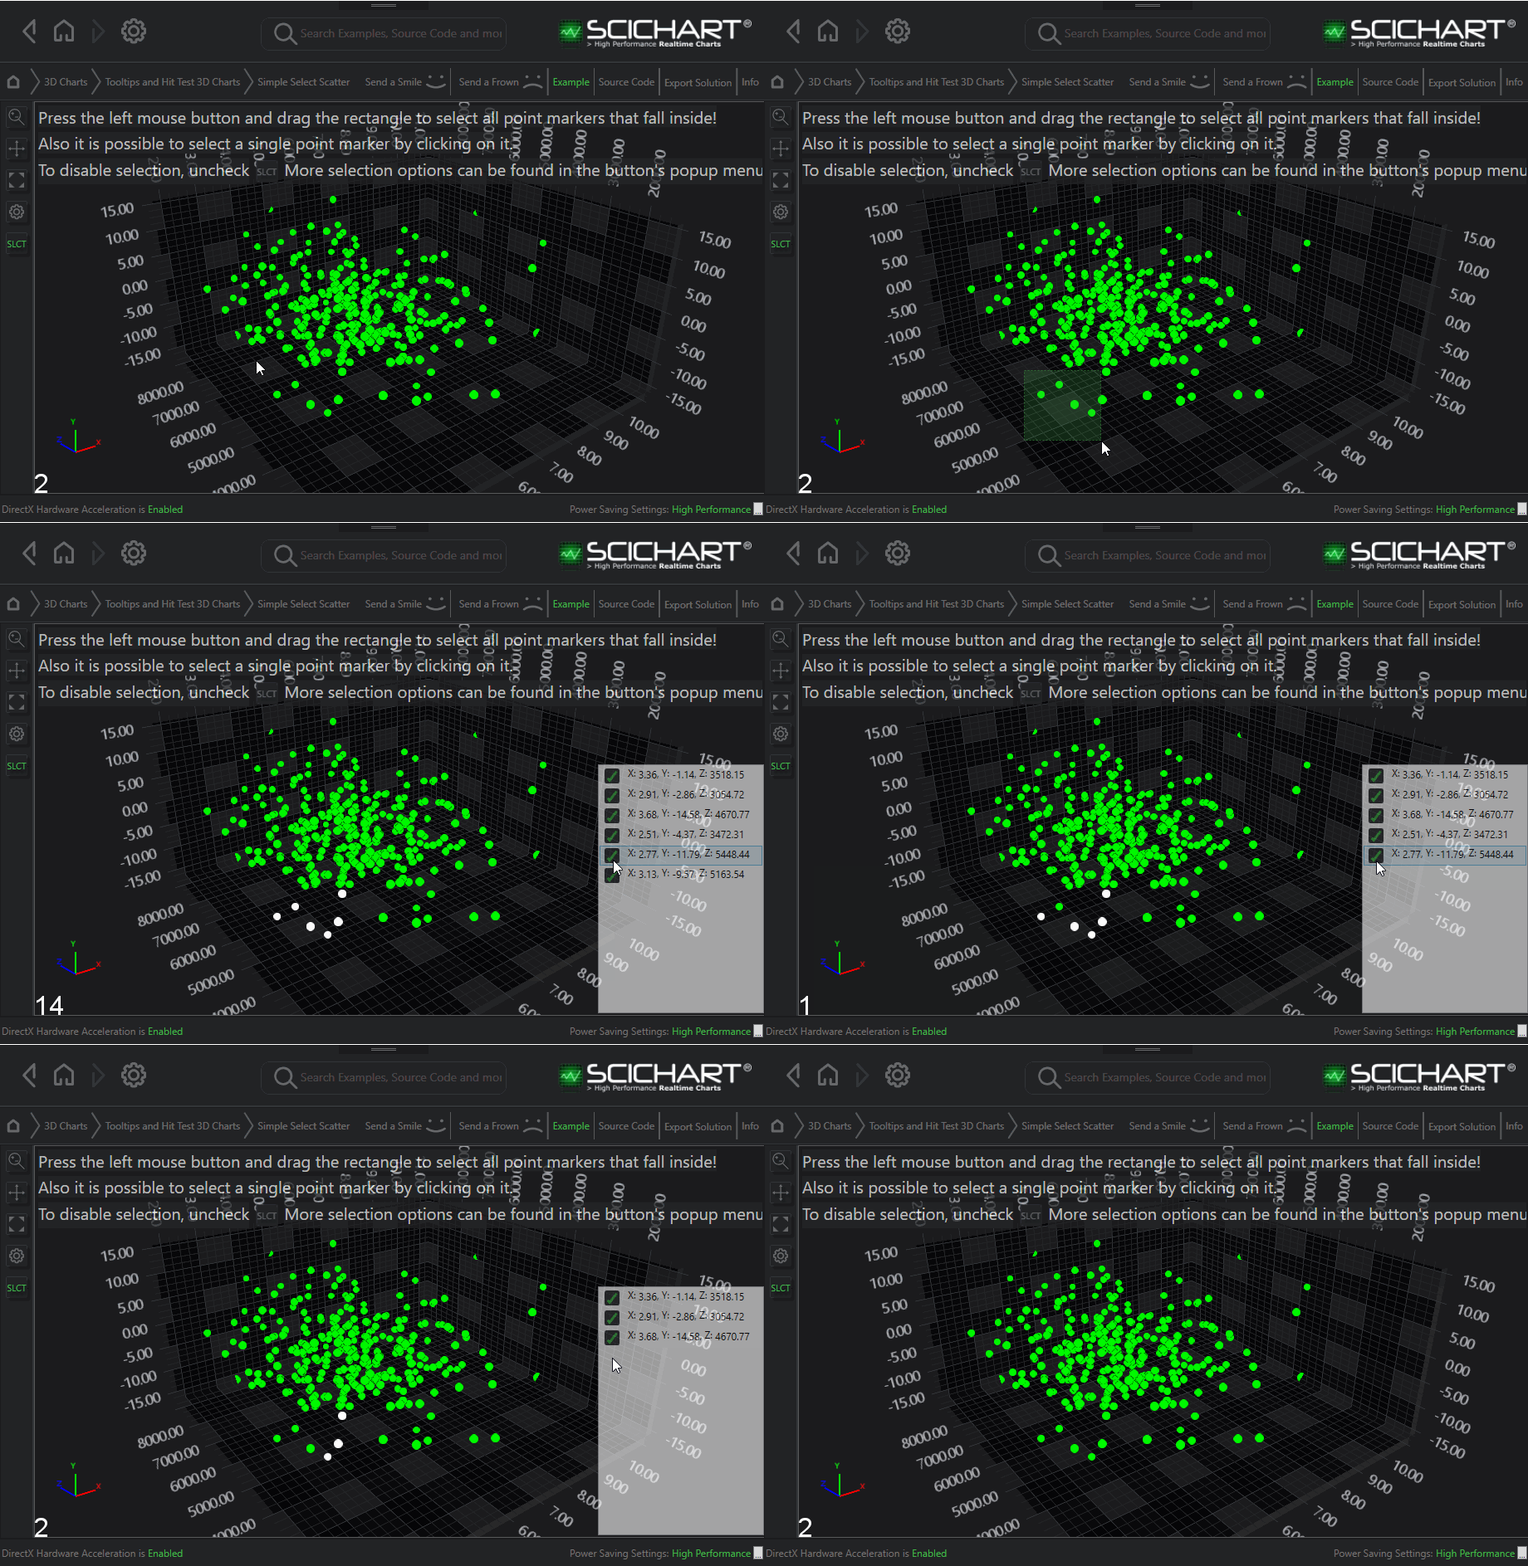
Vertex Selection Modifier
Ther VertexSelectionModifier3D allows you to perform selection of points on a 3D Chart.

Declaring a VertexSelectionModifier3D in XAML
Declaring a VertexSelectionModifier3D is as simple as adding one to the SciChart3DSurface.ChartModifier property. This can be done as a single modifier, or as part of a ModifierGroup3D.
Binding to Selected Points
The VertexSelectionModifier3D modifies the XyzDataSeries3D and adds or updates a PointMetadata3D object at each index with the flag PointMetadata3D.IsSelected = true.
In the example Chart Data-Point Selection Example we demonstrate how you can update a ListBox with selected points by listening to the DataSeriesChanged event.
e.g.
| Example Title |
Copy Code |
|---|---|
_xyzDataSeries3D = new XyzDataSeries3D<double>(); _xyzDataSeries3D.DataSeriesChanged += (s,e) => { List<XyzDataPointViewModel<double>> selectedPoints = new List<XyzDataPointViewModel<double>>(); for (int i = 0; i < _xyzDataSeries3D.Count; i++) { if (_xyzDataSeries3D.WValues[i] != null) { // If the IsSelected flag is true if (_xyzDataSeries3D.WValues[i].IsSelected) { // collect this selected point selectedPoints.Add(new XyzDataPointViewModel<double>(i, _xyzDataSeries3D.XValues[i], _xyzDataSeries3D.YValues[i], _xyzDataSeries3D.ZValues[i], _xyzDataSeries3D.WValues[i])); } } } if (!selectedPoints.IsNullOrEmpty()) { listBox.Visibility = Visibility.Visible; listBox.ItemsSource = selectedPoints; } else listBox.Visibility = Visibility.Collapsed; }; | |
where the ListBox is defined in XAML.
See the Chart Data-Point Selection Example for more information.
