
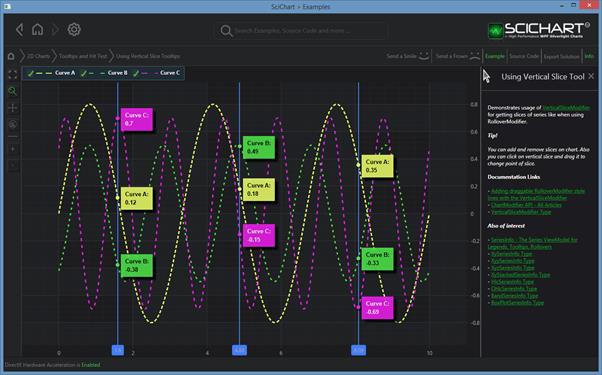
The VerticalSliceModifier allows showing one or more vertical lines on the chart and a tooltip on data-points of all series under the line. The VerticalSliceModifier is very similar in behaviour to the RolloverModifier, but allows one or more lines to be positioned and optionally dragged by the user.
Declaring a VerticalSliceModifier in XAML
Please see the code sample below for how to add a VerticalSliceModifier to a SciChartSurface.
- You must declare a VerticalSliceModifier in the SciChartSurface.ChartModifier (or, inside a ModifierGroup)
- If you wish to add a vertical line, please add a VerticalLineAnnotation to the VerticalSliceModifier.VerticalLines property
- If you wish to remove a vertical line, please remove it from the VerticalSliceModifier.VerticalLines property
| Declaring a VerticalSliceModifier |
Copy Code |
|---|---|
<s:SciChartSurface> <!-- XAxis, YAxis, RenderableSeries omitted for brevity --> <s:SciChartSurface.ChartModifier> <s:ModifierGroup> <s:VerticalSliceModifier Name="sliceModifier"> <s:VerticalSliceModifier.VerticalLines> <s:VerticalLineAnnotation X1="1" /> <s:VerticalLineAnnotation X1="3" /> <s:VerticalLineAnnotation X1="5" /> <s:VerticalLineAnnotation X1="7" /> <s:VerticalLineAnnotation X1="9" /> </s:VerticalSliceModifier.VerticalLines> </s:VerticalSliceModifier> </s:ModifierGroup> </s:SciChartSurface.ChartModifier> </s:SciChartSurface> | |
Declaring a VerticalSliceModifier in Code
To declare a VerticalSliceModifier in code-behind, use the following C# code:
| Declaring a VerticalSliceModifier |
Copy Code |
|---|---|
var sciChartSurface = new SciChartSurface(); sciChartSurface.XAxis = new NumericAxis(); sciChartSurface.YAxis = new NumericAxis(); var verticalSliceModifier = new VerticalSliceModifier(); verticalSliceModifier.VerticalLines.Add(new VerticalLineAnnotation() { X1 = 1 } ); verticalSliceModifier.VerticalLines.Add(new VerticalLineAnnotation() { X1 = 3 } ); sciChartSurface.ChartModifier = new ModifierGroup(verticalSliceModifier); | |
Adding and Removing Vertical Slices
Vertical Slices can be added dynamically onto a chart by adding VerticalLineAnnotations to the VerticalLines collection of a VerticalSliceModifier.
| Adding Vertical Slices |
Copy Code |
|---|---|
verticalSliceModifier.VerticalLines.Add(new VerticalLineAnnotation() { X1 = 1 } ); | |
All VerticalLineAnnotation items from the VerticalSliceModifier.VerticalLines collection are automatically added to the Annotations collection of a SciChartSurface. However, removing them directly from the SciChartSurface.Annotations collection, or clearing the SciChartSurface.Annotations collection will not remove such VerticalLineAnnotations from the chart.
In order to remove Vertical Slices from the chart they must be removed from the VerticalSliceModifier.VerticalLines collection
| Removing Vertical Slices |
Copy Code |
|---|---|
if (verticalSliceModifier.VerticalLines.Contains(verticalLineAnnotation))
{
verticalSliceModifier.VerticalLines.Remove(verticalLineAnnotation);
} | |
Properties of the VerticalSliceModifier
- HoverDelay- The delay for showing tooltips in Milliseconds
- ShowAxisLabels- True/False whether to show the XAxis Label
- ShowTooltipOn- Options for when to show the tooltip, e.g. MouseOver, Always, MouseHover, MouseLeftButtonDown
- TooltipTemplate– An attached property for the Tooltip Item Template (binds to SeriesInfo)
- TooltipContainerStyle– An attached property to style the Tooltip Container
- UseInterpolation- Interpolates data-points for smoother operation of the markers between data-points that are widely spaced
Changing when Tooltips are Shown
You may change when the VerticalSliceModifier Tooltips are shown using the VerticalSliceModifeir.ShowTooltipsOn property. Please see the ShowTooltipOptions for available options.
Showing or Hiding the XAxis Label
You may show or hide the XAxis Label via the VerticalSliceModifier.ShowAxisLabels property.
Styling the VerticalSliceModifier Tooltips
Tooltips for the VerticalSliceModifier are styled in the exact same way as the RolloverModifier and, using the attached properties VerticalSliceModifier.TooltipContainerStyle and VerticalSliceModifier.TooltipTemplate.
NOTE: For a detailed walkthrough of defining TooltipContainerStyle and TooltipTemplate for different series types, please see Styling the Tooltip Item Template, Styling the Tooltip Item Template for other Series Types, Styling the Rollover Axis Label, Styling the Tooltip Container
Styling the Tooltip Item Template
SciChart by default has a number of Tooltip templates which are unique to the series type. To change the Tooltip template, use the VerticalSliceModifier.TooltipTemplate attached property:
NOTE: TooltipTemplate may be shared between the RolloverModifier and VerticalSliceModifier. You do not need to declare two TooltipTemplates if you are using both modifiers. You only need to attach it to the RenderableSeries twice using both RolloverModifier. TooltipTemplate and VerticalSliceModifier.TooltipTemplate.
| Styling the Tooltip Item Template |
Copy Code |
|---|---|
<s:SciChartSurface > <s:SciChartSurface.Resources> <!-- Tooltip Template for an XyDataSeries binds to XySeriesInfo --> <!-- Check out the properties on XySeriesInfo to see what you can bind to --> <DataTemplate x:Key="XyTooltipTemplate" DataType="s:XySeriesInfo"> <StackPanel Orientation="Vertical"> <TextBlock Foreground="White"> <Run Text="Series: "/> <Run Text="{Binding SeriesName, StringFormat='{}{0}:'}"/> </TextBlock> <TextBlock Foreground="White"> <Run Text="X-Value: "/> <Run Text="{Binding FormattedXValue}"/> </TextBlock> <TextBlock Foreground="White"> <Run Text="Y-Value: "/> <Run Text="{Binding FormattedYValue}"/> </TextBlock> </StackPanel> </DataTemplate> </s:SciChartSurface.Resources> <s:SciChartSurface.RenderableSeries> <s:FastLineRenderableSeries s:VerticalSliceModifier.TooltipTemplate="{StaticResource XyTooltipTemplate}"/> </s:SciChartSurface.RenderableSeries> <s:SciChartSurface.ChartModifier> <s:ModifierGroup> <s:RolloverModifier ShowTooltipOn="Always" /> </s:ModifierGroup> </s:SciChartSurface.ChartModifier> </s:SciChartSurface> | |
Styling the VerticalSliceModifier Tooltip Container
The Tooltip container is styled via the VerticalSliceModifier.TooltipContainerStyle Attached property. This property should be set on the BaseRenderableSeries if you wish to override it.
NOTE: TooltipContainerStyles may be shared between the RolloverModifier and VerticalSliceModifier. You do not need to declare two TooltipContainerStyles if you are using both modifiers. You only need to attach it to the RenderableSeries twice using both RolloverModifier.TooltipContainerStyle and VerticalSliceModifier.TooltipContainerStyle.
| Styling the VerticalSliceModifier Tooltip Container |
Copy Code |
|---|---|
<s:SciChartSurface> <s:SciChartSurface.Resources> <!-- The TooltipControl template is defined below --> <!-- Change this if you want to have a non-default tooltip container --> <!-- The ContentPresenter is bound to the DataContext (a SeriesInfo type) --> <!-- and the ContentTemplate is the DataTemplate for the SeriesInfo --> <!-- Finally, the TooltipContainerStyle is set on the RenderableSeries --> <Style x:Key="TooltipStyle1" TargetType="s:TooltipControl"> <Setter Property="Template"> <Setter.Value> <ControlTemplate TargetType="s:TooltipControl"> <Border Background="#ff6495ed" BorderBrush="#ff4d81dd" BorderThickness="2" Effect="{StaticResource DropShadowEffect}" Opacity="0.9" Padding="5"> <ContentPresenter Content="{TemplateBinding DataContext}" ContentTemplate="{TemplateBinding ContentTemplate}" /> </Border> </ControlTemplate> </Setter.Value> </Setter> </Style> </s:SciChartSurface.Resources> <s:SciChartSurface.RenderableSeries> <s:FastLineRenderableSeries s:VerticalSliceModifier.TooltipContainerStyle="{StaticResource TooltipStyle1}"/> </s:SciChartSurface.RenderableSeries> </s:SciChartSurface> | |
Styling the Vertical Lines
The vertical lines themselves are provided by the VerticalLineAnnotation, which works in unison with the VerticalSliceModifier to place tooltips over the Vertical Lines. For instance, the following style applied to VerticalLineAnnotation sets the Stroke, StrokeThickness, ShowLabel on the XAxis, LabelPlacement.
| Styling the Vertical Lines |
Copy Code |
|---|---|
<s:SciChartSurface> <s:SciChartSurface.Resources> <Style x:Key="sliceStyle" TargetType="s:VerticalLineAnnotation"> <Setter Property="ShowLabel" Value="True" /> <Setter Property="Stroke" Value="#427EF6" /> <Setter Property="StrokeThickness" Value="1" /> <Setter Property="IsEditable" Value="True" /> <Setter Property="LabelPlacement" Value="Axis" /> </Style> </s:SciChartSurface.Resources> <!-- XAxis, YAxis, RenderableSeries omitted for brevity --> <s:SciChartSurface.ChartModifier> <s:ModifierGroup> <s:VerticalSliceModifier Name="sliceModifier"> <s:VerticalSliceModifier.VerticalLines> <s:VerticalLineAnnotation X1="1" Style="{Staticresource sliceStyle}"/> </s:VerticalSliceModifier.VerticalLines> </s:VerticalSliceModifier> </s:ModifierGroup> </s:SciChartSurface.ChartModifier> </s:SciChartSurface> | |
NOTE: See The VerticalLineAnnotation Type for detailed information about styling the VerticalLineAnnotation.
Changing the Vertical Line Axis Label Style / Font Color
When attaching VerticalLineAnnotations to the VerticalSliceModifier, you can change the style of the axis label when creating the vertical line. For instance:
| Changing the Vertical Line Axis Label Style / Font Color |
Copy Code |
|---|---|
<s:SciChartSurface> <!-- XAxis, YAxis, RenderableSeries omitted for brevity --> <s:SciChartSurface.ChartModifier> <s:ModifierGroup> <s:VerticalSliceModifier Name="sliceModifier" ShowLabels="FalsE"> <s:VerticalSliceModifier.VerticalLines> <s:VerticalLineAnnotation ShowLabel="False" ...> <s:VerticalLineAnnotation.AnnotationLabels> <s:AnnotationLabel LabelPlacement="Axis" FontSize="16" Foreground="White"/> </s:VerticalLineAnnotation.AnnotationLabels> </s:VerticalLineAnnotation> </s:VerticalSliceModifier.VerticalLines> </s:VerticalSliceModifier> </s:ModifierGroup> </s:SciChartSurface.ChartModifier> </s:SciChartSurface> | |