
Multi-Axis Charts
In SciChart, it is required that each Axis in a corresponding Axis Collection has a unique identifier. This is a string that can be provided via the Axis.Id property. By default, all axes have a default Axis ID.
For single-axis charts there is no need to set Axis Id. As soon as there is a secondary Axis, you need to start assigning IDs to all Axes in the corresponding Axis Collection.
In such multiple-axis scenarios, some SciChart types such as Renderable Series, Annotations, Chart Modifiers can be associated with a certain Axis. Their API usually exposes XAxisId and YAxisId properties that can be used to associate this type with a specific X or Y Axis.
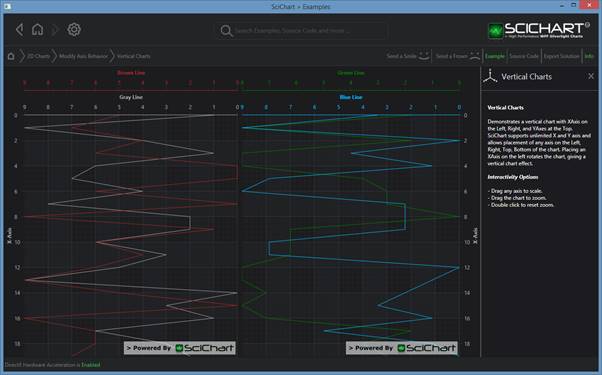
Rotating a Chart (Vertical Oriented Chart)
SciChart supports unlimited, multiple XAxis on the Left/Right and unlimited, multiple YAxis on the Top/Bottom of a chart (rotated charts). To rotate a chart, simply set XAxis.AxisAlignment to Left or Right, and YAxis.AxisAlignment to Top or Bottom. SciChart takes care of the rest.
| Rotating a Chart (Vertical Oriented Chart) |
Copy Code |
|---|---|
<!-- Declare a chart with two YAxis at the top. --> <!-- where xmlns:s="http://schemas.abtsoftware.co.uk/scichart" --> <s:SciChartSurface Name="sciChartLeft" Grid.Column="0" Margin="0 0 10 0" s:HorizontalGroupHelper.HorizontalChartGroup="MyHorizontalGroup"> <!-- Define the XAxis for this chart on the Left --> <s:SciChartSurface.XAxis> <s:NumericAxis AxisAlignment="Left" AxisTitle="X-Axis" DrawMajorBands="True"/> </s:SciChartSurface.XAxis> <!-- Define multiple YAxis on the top --> <s:SciChartSurface.YAxes> <s:NumericAxis AxisAlignment="Top" AxisTitle="Gray Line" BorderBrush="DarkGray" BorderThickness="0,0,0,1" Id="Top1" TickTextBrush="DarkGray"/> <s:NumericAxis AxisAlignment="Top" AxisTitle="Brown Line" BorderBrush="Brown" BorderThickness="0,0,0,1" Id="Top2" TickTextBrush="Brown"/> </s:SciChartSurface.YAxes> </s:SciChartSurface> | |
Mixed Charts, charts with XAxis, YAxis on the left/right as well as Top/Bottom
SciChart allows any combination of XAxis, YAxis alignment to create charts with mixed horizontal and vertical charts.
In the following example we declare one series (Orange) with XAxis on the Left / YAxis on the Top, and a second series (Blue) with XAxis on the bottom / YAxis on the right.
| Mixed Charts, charts with XAxis, YAxis on the left/right as well as Top/Bottom |
Copy Code |
|---|---|
<s:SciChartSurface> <s:SciChartSurface.XAxes> <s:NumericAxis Id="X1" AxisAlignment="Left" AxisTitle="Left XAxis" TickTextBrush="Orange"/> <s:NumericAxis Id="X2" AxisAlignment="Bottom" AxisTitle="Bottom XAxis" TickTextBrush="SteelBlue"/> </s:SciChartSurface.XAxes> <s:SciChartSurface.YAxes> <s:NumericAxis Id="Y1" AxisAlignment="Top" AxisTitle="Top YAxis" TickTextBrush="Orange"/> <s:NumericAxis Id="Y2" AxisAlignment="Right" AxisTitle="Right YAxis" TickTextBrush="SteelBlue"/> </s:SciChartSurface.YAxes> </s:SciChartSurface> | |