WPF Chart - Examples
SciChart WPF ships with hundreds of WPF Chart Examples which you can browse, play with, view the source-code and even export each WPF Chart Example to a stand-alone Visual Studio solution. All of this is possible with the new and improved SciChart WPF Examples Suite, which ships as part of the SciChart WPF SDK.
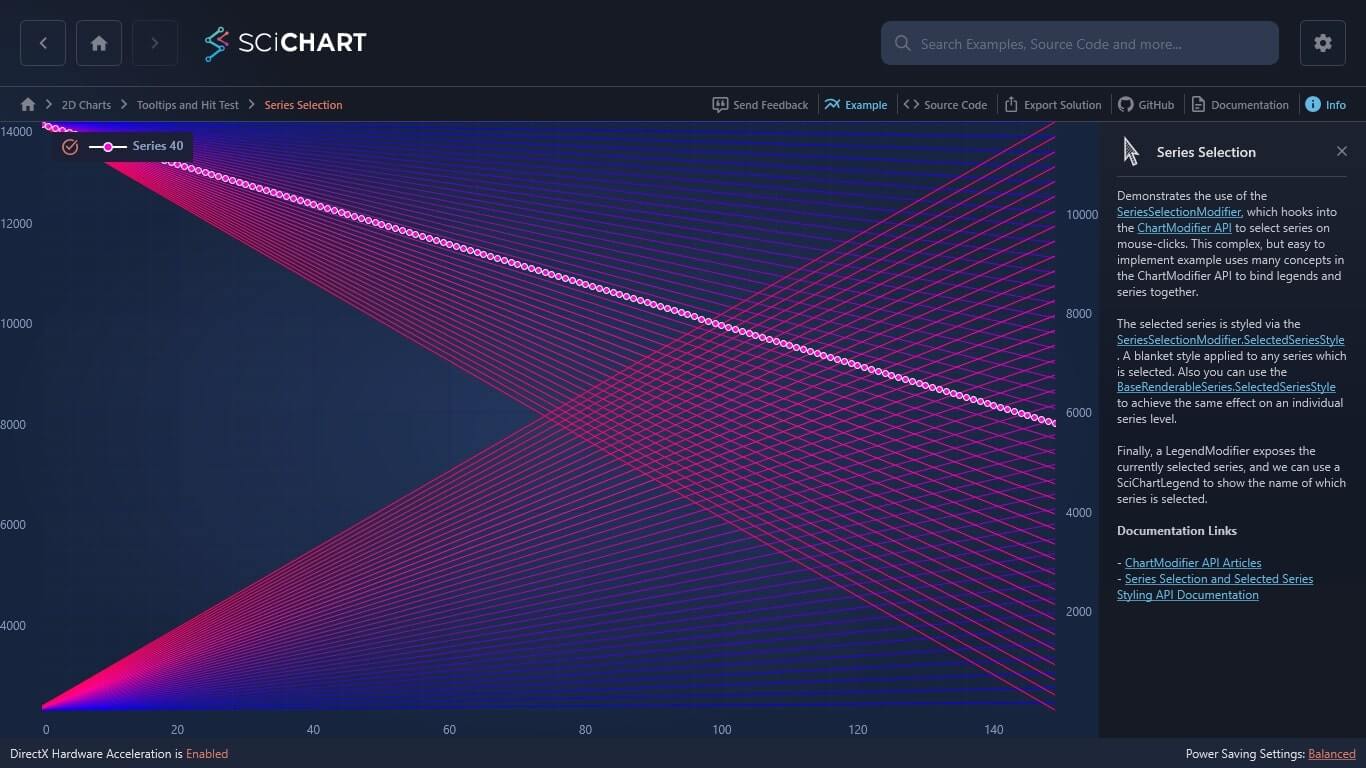
Demonstrates the use of the SeriesSelectionModifier, which hooks into the ChartModifier API to select series on mouse-clicks. This complex, but easy to implement example uses many concepts in the ChartModifier API to bind legends and series together.
The selected series is styled via the SeriesSelectionModifier.SelectedSeriesStyle. A blanket style applied to any series which is selected. Also you can use the BaseRenderableSeries.SelectedSeriesStyle to achieve the same effect on an individual series level.
Finally, a LegendModifier exposes the currently selected series, and we can use a SciChartLegend to show the name of which series is selected.
Documentation Links
– ChartModifier API Articles
– Series Selection and Selected Series Styling API Documentation

The C#/WPF source code for the WPF Chart Series Selection example is included below (Scroll down!).
Did you know you can also view the source code from one of the following sources as well?
- Clone the SciChart.WPF.Examples from Github.
- Or, view source in the SciChart WPF Examples suite.
- Also the SciChart WPF Trial contains the full source for the examples (link below).
SeriesSelectionExampleView.xaml
View source code<UserControl x:Class="SciChart.Examples.Examples.InspectDatapoints.SeriesSelectionExampleView"
xmlns="http://schemas.microsoft.com/winfx/2006/xaml/presentation"
xmlns:x="http://schemas.microsoft.com/winfx/2006/xaml"
xmlns:d="http://schemas.microsoft.com/expression/blend/2008"
xmlns:mc="http://schemas.openxmlformats.org/markup-compatibility/2006"
xmlns:s="http://schemas.abtsoftware.co.uk/scichart"
Loaded="SeriesSelectionExampleView_OnLoaded"
d:DesignHeight="400"
d:DesignWidth="600"
mc:Ignorable="d">
<Grid>
<s:SciChartSurface x:Name="sciChartSurface">
<!-- Declare Axes -->
<s:SciChartSurface.XAxis>
<s:NumericAxis AutoRange="Always" />
</s:SciChartSurface.XAxis>
<s:SciChartSurface.YAxes>
<s:NumericAxis AxisAlignment="Right" Id="Right" />
<s:NumericAxis AxisAlignment="Left" Id="Left" />
</s:SciChartSurface.YAxes>
<!-- Declare ChartModifiers -->
<s:SciChartSurface.ChartModifier>
<s:ModifierGroup>
<!-- Provides Interactivity -->
<s:RubberBandXyZoomModifier />
<s:XAxisDragModifier />
<s:YAxisDragModifier AxisId="Left" />
<s:YAxisDragModifier AxisId="Right" />
<s:ZoomExtentsModifier />
<!-- Provides selection of series and custom styling to the selected series -->
<s:SeriesSelectionModifier>
<s:SeriesSelectionModifier.SelectedSeriesStyle>
<!-- When a series is selected (on click), apply this style -->
<!-- Changes Stroke to white on click -->
<!-- Applies a PointMarker on click -->
<Style TargetType="s:BaseRenderableSeries">
<Setter Property="Stroke" Value="White" />
<Setter Property="PointMarkerTemplate">
<Setter.Value>
<!-- This is how we do PointMarkerTemplates in Scichart v2.0. You can either declare an EllipsePointMarker inline, -->
<!-- or, if temmplating (because you are sharing a style across many series), then use a ControlTemplate with a BasePointMarker, -->
<!-- or UIElement to replicate across each data-point -->
<ControlTemplate>
<s:EllipsePointMarker Width="7"
Height="7"
Fill="#FF00DC"
Stroke="White" />
</ControlTemplate>
</Setter.Value>
</Setter>
</Style>
</s:SeriesSelectionModifier.SelectedSeriesStyle>
</s:SeriesSelectionModifier>
<!-- Provides a data source for the legend control -->
<s:LegendModifier Margin="10"
GetLegendDataFor="SelectedSeries"
ShowLegend="True" />
</s:ModifierGroup>
</s:SciChartSurface.ChartModifier>
</s:SciChartSurface>
</Grid>
</UserControl>
SeriesSelectionExampleView.xaml.cs
View source code// *************************************************************************************
// SCICHART® Copyright SciChart Ltd. 2011-2022. All rights reserved.
//
// Web: http://www.scichart.com
// Support: support@scichart.com
// Sales: sales@scichart.com
//
// SeriesSelectionExampleView.xaml.cs is part of the SCICHART® Examples. Permission is hereby granted
// to modify, create derivative works, distribute and publish any part of this source
// code whether for commercial, private or personal use.
//
// The SCICHART® examples are distributed in the hope that they will be useful, but
// without any warranty. It is provided "AS IS" without warranty of any kind, either
// expressed or implied.
// *************************************************************************************
using System.Linq;
using System.Windows;
using System.Windows.Controls;
using System.Windows.Media;
using SciChart.Charting.Model.DataSeries;
using SciChart.Charting.Visuals.Axes;
using SciChart.Charting.Visuals.RenderableSeries;
using SciChart.Examples.ExternalDependencies.Data;
namespace SciChart.Examples.Examples.InspectDatapoints
{
public partial class SeriesSelectionExampleView : UserControl
{
private const int SeriesPointCount = 150;
private const int SeriesCount = 80;
public SeriesSelectionExampleView()
{
InitializeComponent();
}
public void SeriesSelectionExampleView_OnLoaded(object sender, RoutedEventArgs e)
{
// Create a number of DataSeries of type X=double, Y=double
var allDataSeries = new IUniformXyDataSeries<double>[SeriesCount];
var initialColor = Colors.Blue;
// Suspend visual updates while we add N RenderableSeries
using (sciChartSurface.SuspendUpdates())
{
// Add N data and renderable series
for (int i = 0; i < SeriesCount; i++)
{
AxisAlignment alignment = i % 2 == 0 ? AxisAlignment.Left : AxisAlignment.Right;
allDataSeries[i] = GenerateDataSeries(alignment, i);
var renderableSeries = new FastLineRenderableSeries {Stroke = initialColor};
renderableSeries.YAxisId = alignment.ToString();
// Assign DataSeries to RenderableSeries
renderableSeries.DataSeries = allDataSeries[i];
// Assign RenderableSeries to SciChartSurface
sciChartSurface.RenderableSeries.Add(renderableSeries);
// Colors are incremented for visual purposes only
int newR = initialColor.R == 255 ? 255 : initialColor.R + 5;
int newB = initialColor.B == 0 ? 0 : initialColor.B - 2;
initialColor = Color.FromArgb(255, (byte) newR, initialColor.G, (byte) newB);
}
}
sciChartSurface.RenderableSeries[SeriesCount / 2].IsSelected = true;
sciChartSurface.ZoomExtents();
}
private IUniformXyDataSeries<double> GenerateDataSeries(AxisAlignment axisAlignment, int index)
{
var dataSeries = new UniformXyDataSeries<double>
{
SeriesName = string.Format("Series {0}", index)
};
double gradient = axisAlignment == AxisAlignment.Right ? index : -index;
double start = axisAlignment == AxisAlignment.Right ? 0.0 : 14000;
dataSeries.Append(DataManager.Instance.GetStraightLineYData(gradient, start, SeriesPointCount));
return dataSeries;
}
}
}
