WPF Chart - Examples
SciChart WPF ships with hundreds of WPF Chart Examples which you can browse, play with, view the source-code and even export each WPF Chart Example to a stand-alone Visual Studio solution. All of this is possible with the new and improved SciChart WPF Examples Suite, which ships as part of the SciChart WPF SDK.
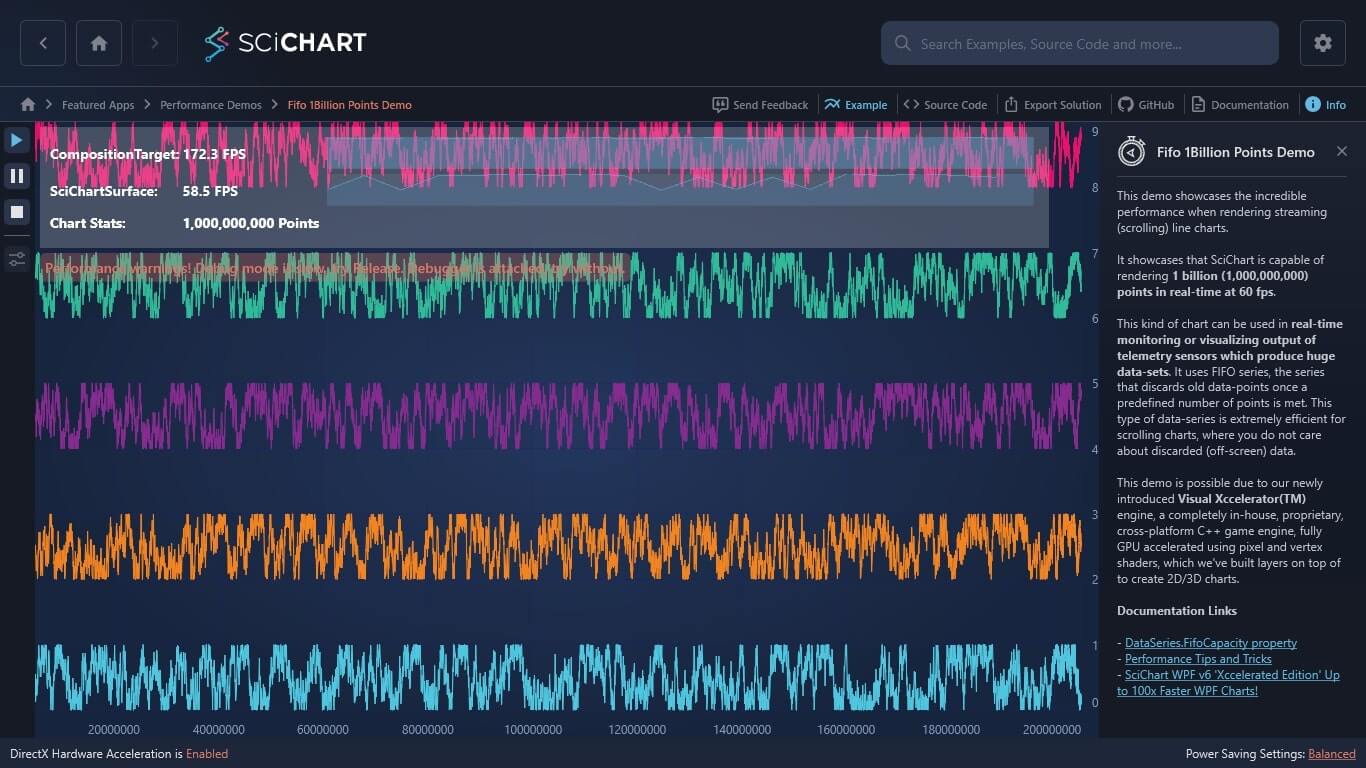
This demo showcases the incredible performance when rendering streaming (scrolling) line charts.
It showcases that SciChart is capable of rendering 1 billion (1,000,000,000) points in real-time at 60 fps.
This kind of chart can be used in real-time monitoring or visualizing output of telemetry sensors which produce huge data-sets. It uses FIFO series, the series that discards old data-points once a predefined number of points is met. This type of data-series is extremely efficient for scrolling charts, where you do not care about discarded (off-screen) data.
This demo is possible due to our newly introduced Visual Xccelerator(TM) engine, a completely in-house, proprietary, cross-platform C++ game engine, fully GPU accelerated using pixel and vertex shaders, which we’ve built layers on top of to create 2D/3D charts.
Documentation Links
– DataSeries.FifoCapacity property
– Performance Tips and Tricks
– SciChart WPF v6 ‘Xccelerated Edition’ Up to 100x Faster WPF Charts!

The C#/WPF source code for the WPF Chart FIFO 1 billion points demo example is included below (Scroll down!).
Did you know you can also view the source code from one of the following sources as well?
- Clone the SciChart.WPF.Examples from Github.
- Or, view source in the SciChart WPF Examples suite.
- Also the SciChart WPF Trial contains the full source for the examples (link below).
FifoBillionPointsPageView.xaml
View source code<UserControl x:Class="SciChart.Examples.Examples.PerformanceDemos2D.FifoBillionPoints.FifoBillionPointsPageView"
xmlns="http://schemas.microsoft.com/winfx/2006/xaml/presentation"
xmlns:x="http://schemas.microsoft.com/winfx/2006/xaml"
xmlns:d="http://schemas.microsoft.com/expression/blend/2008"
xmlns:mc="http://schemas.openxmlformats.org/markup-compatibility/2006"
xmlns:local="clr-namespace:SciChart.Examples.Examples.PerformanceDemos2D.FifoBillionPoints"
xmlns:s="http://schemas.abtsoftware.co.uk/scichart"
xmlns:ext="http://schemas.abtsoftware.co.uk/scichart/exampleExternals"
d:DesignHeight="400"
d:DesignWidth="600"
mc:Ignorable="d">
<UserControl.Resources>
<local:FifoBillionPointsPageViewModel x:Key="vm"/>
<BooleanToVisibilityConverter x:Key="b2vc"/>
</UserControl.Resources>
<Grid DataContext="{StaticResource vm}">
<Grid.ColumnDefinitions>
<ColumnDefinition Width="Auto"/>
<ColumnDefinition Width="*"/>
</Grid.ColumnDefinitions>
<!-- Toolbar -->
<Border Background="#FF232426" BorderThickness="0,0,2,0" BorderBrush="#323539" Canvas.ZIndex="9999">
<StackPanel Orientation="Vertical">
<RadioButton Command="{Binding RunCommand}" Style="{StaticResource PlayButtonStyle}" Padding="4"/>
<RadioButton Command="{Binding StopCommand}" IsChecked="True" Style="{StaticResource StopButtonStyle}" Padding="7"/>
<ext:FlyoutSeparator Background="#444"/>
<ext:FlyoutMenuButton IsEnabled="{Binding IsStopped}" Style="{StaticResource FlyoutMenuButtonStyle}" Content="PC" Padding="0">
<ext:FlyoutMenuButton.PopupContent>
<StackPanel Orientation="Vertical" MinWidth="150">
<TextBlock Text="Point Count:"/>
<ComboBox Margin="5"
SelectedItem="{Binding SelectedPointCount}"
DisplayMemberPath="DisplayName"
ItemsSource="{Binding AllPointCounts}"/>
</StackPanel>
</ext:FlyoutMenuButton.PopupContent>
</ext:FlyoutMenuButton>
</StackPanel>
</Border>
<!-- Chart Surface -->
<Grid Grid.Column="1">
<s:SciChartSurface x:Name="scs"
RenderableSeries="{s:SeriesBinding Series}"
ViewportManager="{Binding ViewportManager}"
s:VisualXcceleratorEngine.IsEnabled="True"
s:VisualXcceleratorEngine.FallbackType="{x:Type s:HighQualityRenderSurface}"
s:VisualXcceleratorEngine.DowngradeWithoutException="False"
s:VisualXcceleratorEngine.EnableImpossibleMode="True">
<s:SciChartSurface.XAxis>
<s:NumericAxis AutoRange="Always"
DrawMinorGridLines="False"
DrawMinorTicks="False"/>
</s:SciChartSurface.XAxis>
<s:SciChartSurface.YAxis>
<s:NumericAxis AutoRange="Never"
DrawMinorGridLines="False"
DrawMinorTicks="False"
VisibleRange="0,9"/>
</s:SciChartSurface.YAxis>
<!-- Some hints to the user -->
<s:SciChartSurface.Annotations>
<s:CustomAnnotation CoordinateMode="Relative"
HorizontalAnchorPoint="Left"
VerticalAnchorPoint="Top"
Margin="0,120,0,0"
X1="0"
Y1="0">
<Border Background="#88232323">
<Grid Margin="10">
<Grid.RowDefinitions>
<RowDefinition Height="Auto"/>
<RowDefinition Height="Auto"/>
</Grid.RowDefinitions>
<StackPanel Grid.Row="0" Orientation="Horizontal" HorizontalAlignment="Left">
<TextBlock FontSize="20"
Opacity="0.7"
Text="Click "
Foreground="#FFF"/>
<Image Width="32"
Height="32"
Source="/SciChart.Examples;component/Resources/Images/point_count_icon.png"
Stretch="None"/>
<TextBlock FontSize="20"
Opacity="0.7"
Text=" to select a point count and "
Foreground="#FFF"/>
<Image Width="32"
Height="32"
Source="/SciChart.Examples;component/Resources/Images/start_button.png"
Stretch="None"/>
<TextBlock FontSize="20"
Opacity="0.7"
Text=" to run the demo"
Foreground="#FFF"/>
</StackPanel>
<TextBlock Grid.Row="1"
Text="{Binding PerformanceWarnings}"
FontSize="14"
Margin="0,5,0,0"
Foreground="OrangeRed"
HorizontalAlignment="Left"
Visibility="{Binding HasWarnings, Mode=OneWay, Converter={StaticResource b2vc}}"/>
</Grid>
</Border>
</s:CustomAnnotation>
</s:SciChartSurface.Annotations>
</s:SciChartSurface>
<s:SciChartPerformanceOverlay Margin="0,0,50,0"
VerticalAlignment="Top"
Background="#33FFFFFF"
FontWeight="Bold"
Foreground="#FFF"
Padding="10"
IsHitTestVisible="False"
TargetSurface="{Binding ElementName=scs}" />
</Grid>
<Border Grid.Column="1" Background="#FF1C1C1E" Visibility="{Binding IsLoading, Mode=OneWay, Converter={StaticResource b2vc}}">
<StackPanel Orientation="Vertical" HorizontalAlignment="Center" VerticalAlignment="Center">
<ProgressBar Background="Transparent" BorderThickness="0" HorizontalAlignment="Center" IsIndeterminate="True" Height="10" Width="{Binding ActualWidth, Mode=OneWay, ElementName=Test}"/>
<TextBlock x:Name="Test" Text="{Binding LoadingMessage, Mode=OneWay}" FontSize="16" Foreground="#FFF" Margin="0,10" TextAlignment="Center" Opacity="0.7"/>
</StackPanel>
</Border>
</Grid>
</UserControl>FifoBillionPointsPageView.xaml.cs
View source code// *************************************************************************************
// SCICHART® Copyright SciChart Ltd. 2011-2019. All rights reserved.
//
// Web: http://www.scichart.com
// Support: support@scichart.com
// Sales: sales@scichart.com
//
// FifoBillionPointsPageView.xaml.cs is part of the SCICHART® Examples. Permission is hereby granted
// to modify, create derivative works, distribute and publish any part of this source
// code whether for commercial, private or personal use.
//
// The SCICHART® examples are distributed in the hope that they will be useful, but
// without any warranty. It is provided "AS IS" without warranty of any kind, either
// expressed or implied.
// *************************************************************************************
using System.Windows.Controls;
namespace SciChart.Examples.Examples.PerformanceDemos2D.FifoBillionPoints
{
public partial class FifoBillionPointsPageView : UserControl
{
public FifoBillionPointsPageView()
{
InitializeComponent();
}
}
}FifoBillionPointsPageViewModel.cs
View source codeusing System;
using System.Collections.Generic;
using System.Collections.ObjectModel;
using System.Diagnostics;
using System.Linq;
using System.Threading.Tasks;
using System.Windows.Media;
using SciChart.Charting.Common.Helpers;
using SciChart.Charting.Model.ChartSeries;
using SciChart.Charting.Model.DataSeries;
using SciChart.Charting.ViewportManagers;
using SciChart.Core.Extensions;
using SciChart.Examples.ExternalDependencies.Common;
namespace SciChart.Examples.Examples.PerformanceDemos2D.FifoBillionPoints
{
public class FifoBillionPointsPageViewModel : BaseViewModel
{
private bool _isStopped;
private string _loadingMessage;
private readonly NoLockTimer _timer;
private const int AppendCount = 10_000; // The number of points to append per timer tick
private const int TimerIntervalMs = 10; // Interval of timer tick
private readonly float[] _xBuffer = new float[AppendCount];
private readonly float[] _yBuffer = new float[AppendCount];
private PointCount _selectedPointCount;
public FifoBillionPointsPageViewModel()
{
_isStopped = true;
_timer = new NoLockTimer(TimeSpan.FromMilliseconds(TimerIntervalMs), OnTimerTick);
RunCommand = new ActionCommand(OnRun, () => !IsLoading);
StopCommand = new ActionCommand(OnStop, () => !IsLoading);
// Add the point count options
AllPointCounts.Add(new PointCount("1 Million", 5, 200_000));
AllPointCounts.Add(new PointCount("5 Million", 5, 1_000_000));
AllPointCounts.Add(new PointCount("10 Million", 5, 2_000_000));
AllPointCounts.Add(new PointCount("50 Million", 5, 10_000_000));
// If you have 8GB of RAM or more you can render 100M (will require just 1GB but to be safe...)
if (SysInfo.GetRamGb() >= 8)
{
AllPointCounts.Add(new PointCount("100 Million", 5, 20_000_000));
}
// Add further test cases depending on system RAM and 64/32bit status and how much RAM
// 1 Billion points requires 8GB of free RAM or it will hit swap drive
if (Environment.Is64BitProcess && SysInfo.GetRamGb() >= 16)
{
// Note: these point counts require the experimental VisualXccelerator.EnableImpossibleMode flag set to true on the chart
AllPointCounts.Add(new PointCount("500 Million", 5, 100_000_000));
AllPointCounts.Add(new PointCount("1 Billion", 5, 200_000_000));
}
// Setup some warnings
PerformanceWarnings = GetPerformanceWarnings();
// Get ready to rock & roll
SelectedPointCount = AllPointCounts.Last();
}
public string PerformanceWarnings { get; }
public bool HasWarnings => !string.IsNullOrEmpty(PerformanceWarnings);
public ObservableCollection<IRenderableSeriesViewModel> Series { get; } = new ObservableCollection<IRenderableSeriesViewModel>();
public ObservableCollection<PointCount> AllPointCounts { get; } = new ObservableCollection<PointCount>();
public DefaultViewportManager ViewportManager { get; } = new DefaultViewportManager();
public PointCount SelectedPointCount
{
get => _selectedPointCount;
set
{
_selectedPointCount = value;
OnPropertyChanged("SelectedPointCount");
}
}
public ActionCommand RunCommand { get; }
public ActionCommand StopCommand { get; }
public bool IsStopped
{
get => _isStopped;
set
{
_isStopped = value;
OnPropertyChanged("IsStopped");
}
}
public bool IsLoading => !string.IsNullOrEmpty(LoadingMessage);
public string LoadingMessage
{
get => _loadingMessage;
set
{
_loadingMessage = value;
OnPropertyChanged("LoadingMessage");
OnPropertyChanged("IsLoading");
RunCommand.RaiseCanExecuteChanged();
StopCommand.RaiseCanExecuteChanged();
}
}
private async void OnRun()
{
if (!IsStopped) return;
int seriesCount = SelectedPointCount.SeriesCount;
int pointCount = SelectedPointCount.PointsCount;
LoadingMessage = $"Generating {SelectedPointCount.DisplayName} Points...";
IsStopped = false;
// Load the points
var series = await CreateSeriesAsync(seriesCount, pointCount);
using (ViewportManager.SuspendUpdates())
{
series.ForEachDo(x => Series.Add(x));
}
_timer.Start();
LoadingMessage = null;
}
private static async Task<List<IRenderableSeriesViewModel>> CreateSeriesAsync(int seriesCount, int pointCount)
{
return await Task.Run(() =>
{
// Create N series of M points async. Return to calling code to set on the chart
IRenderableSeriesViewModel[] series = new IRenderableSeriesViewModel[seriesCount];
// We generate data in parallel as just generating 1,000,000,000 points takes a long time no matter how fast your chart is!
Parallel.For(0, seriesCount, i =>
{
// Temporary buffer for fast filling of DataSeries
var xBuffer = new float[AppendCount];
var yBuffer = new float[AppendCount];
int randomSeed = i * short.MaxValue;
var randomWalkGenerator = new Rand(randomSeed);
var xyDataSeries = new XyDataSeries<float, float>
{
// Required for scrolling / streaming 'first in first out' charts
FifoCapacity = pointCount,
Capacity = pointCount,
// Optional to improve performance when you know in advance whether
// data is sorted ascending and contains float.NaN or not
DataDistributionCalculator = new UserDefinedDistributionCalculator<float, float>
{
ContainsNaN = false,
IsEvenlySpaced = true,
IsSortedAscending = true,
},
// Just associate a random walk generator with the series for more consistent random generation
Tag = randomWalkGenerator
};
int yOffset = i + i;
for (int j = 0; j < pointCount; j += AppendCount)
{
for (int k = 0; k < AppendCount; k++)
{
xBuffer[k] = j + k;
yBuffer[k] = randomWalkGenerator.NextWalk() + yOffset;
}
xyDataSeries.Append(xBuffer, yBuffer);
}
// Store the series
series[i] = new LineRenderableSeriesViewModel
{
DataSeries = xyDataSeries,
Stroke = GetRandomColor()
};
});
// Force a GC Collect before we begin
GC.Collect(GC.MaxGeneration, GCCollectionMode.Forced, true);
return series.ToList();
});
}
private static Color GetRandomColor()
{
return Color.FromRgb(Rand.NextByte(55), Rand.NextByte(55), Rand.NextByte(55));
}
private string GetPerformanceWarnings()
{
#if DEBUG
// Debug mode is the cause of all performance woes. Try release mode?
var warnings = new List<string> {"Debug mode is slow, try Release"};
#else
var warnings = new List<string>();
#endif
if (Debugger.IsAttached)
{
// Its considerably slower to run the code when debugger is attached. Warn the user
warnings.Add("Debugger is attached, try without");
}
if (SysInfo.GetRamGb() <= 8)
{
// Hmm, time to upgrade? :)
warnings.Add("Low system RAM, try on 16GB machine?");
}
return warnings.Any() ? "Performance warnings! " + string.Join(". ", warnings) : null;
}
private void OnStop()
{
if (IsStopped) return;
lock (Series)
{
_timer.Stop();
IsStopped = true;
Series.ForEachDo(x => x.DataSeries.FifoCapacity = 1);
Series.Clear();
}
GC.Collect(GC.MaxGeneration, GCCollectionMode.Forced);
}
private void OnTimerTick()
{
lock (Series)
{
// Freeze updates on scichart UI
using (ViewportManager.SuspendUpdates())
{
int seriesIndex = 0;
foreach (var series in Series)
{
var dataSeries = (XyDataSeries<float, float>)series.DataSeries;
var randomWalkGenerator = (Rand)dataSeries.Tag;
int startIndex = (int)dataSeries.XValues.Last() + 1;
int yOffset = seriesIndex + seriesIndex;
for (int i = 0, j = startIndex; i < AppendCount; i++, j++)
{
_xBuffer[i] = j;
_yBuffer[i] = randomWalkGenerator.NextWalk() + yOffset;
}
dataSeries.Append(_xBuffer, _yBuffer);
seriesIndex++;
}
}
}
}
}
}