WPF Chart - Examples
SciChart WPF ships with hundreds of WPF Chart Examples which you can browse, play with, view the source-code and even export each WPF Chart Example to a stand-alone Visual Studio solution. All of this is possible with the new and improved SciChart WPF Examples Suite, which ships as part of the SciChart WPF SDK.
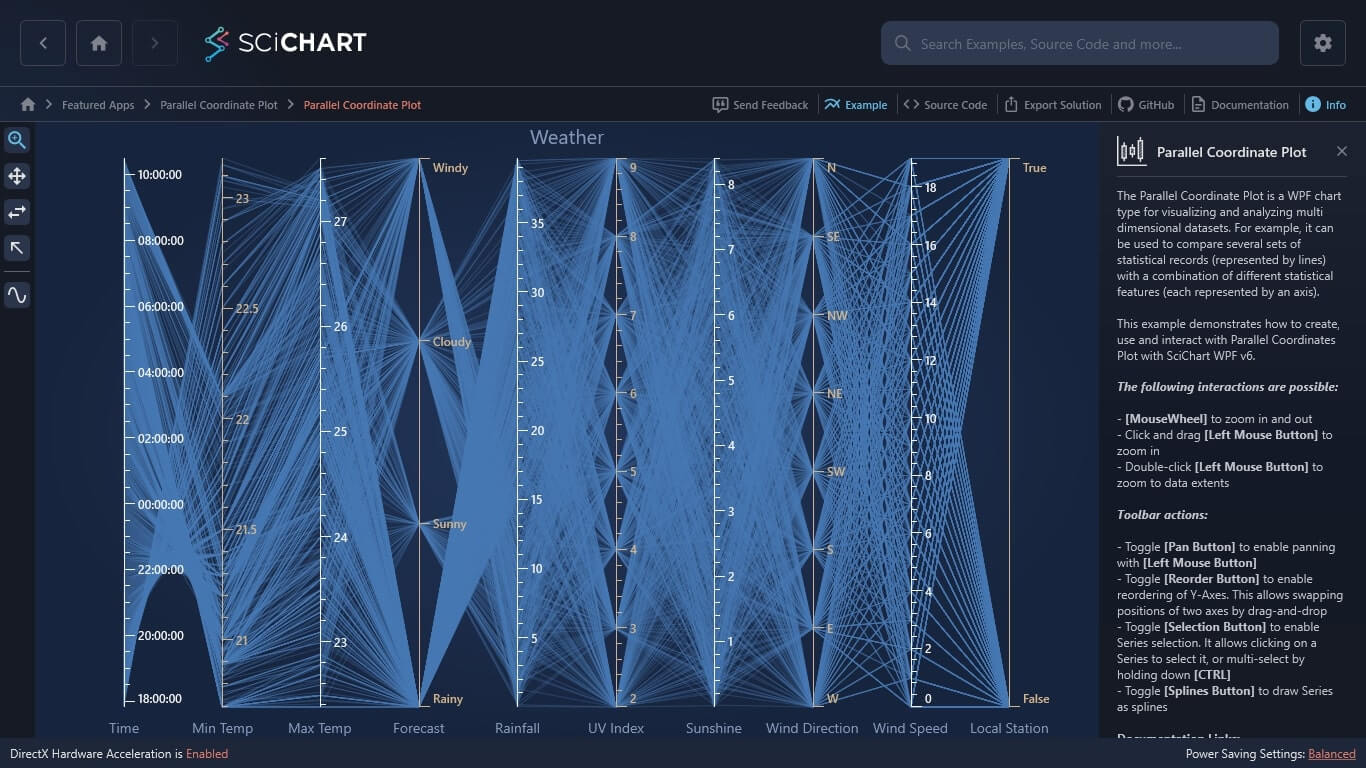
The Parallel Coordinate Plot is a WPF chart type for visualizing and analyzing multi dimensional datasets. For example, it can be used to compare several sets of statistical records (represented by lines) with a combination of different statistical features (each represented by an axis).
This example demonstrates how to create, use and interact with Parallel Coordinates Plot with SciChart WPF v6.
The following interactions are possible:
- Mousewheel to zoom in and out
- Click and Drag Left Mouse Button to zoom in
- Double click Left Mouse Button to zoom to data extents
Toolbar Actions
- Toggle Pan button to enable Panning with the Left Mouse Button
- Toggle Reorder button to enable drag-to-reorder Y Axis. This allows swapping positions of two axes by drag & drop.
- Toggle Selection button to enable series selection. Multi select is possible by holding CTRL
- Toggle Splines button to draw Series as Spline Lines

The C#/WPF source code for the WPF Parallel Coordinate Plot example is included below (Scroll down!).
Did you know you can also view the source code from one of the following sources as well?
- Clone the SciChart.WPF.Examples from Github.
- Or, view source in the SciChart WPF Examples suite.
- Also the SciChart WPF Trial contains the full source for the examples (link below).
