SciChart® the market leader in Fast WPF Charts, WPF 3D Charts, iOS Chart, Android Chart and JavaScript Chart Components
Please note! These examples are new to SciChart Mobile v3 release! SciChart iOS & Android ship with Xamarin.iOS and Xamarin.Android bindings around our native iOS & Android Chart controls, allowing you to create fast & feature rich charts to your Xamarin applications. We include ~90 native iOS examples and 90 Android examples, but now also ~60 Xamarin Chart Examples to help you get started with SciChart. You can download the source for our Xamarin Chart Examples from Github, or browse the source code below.
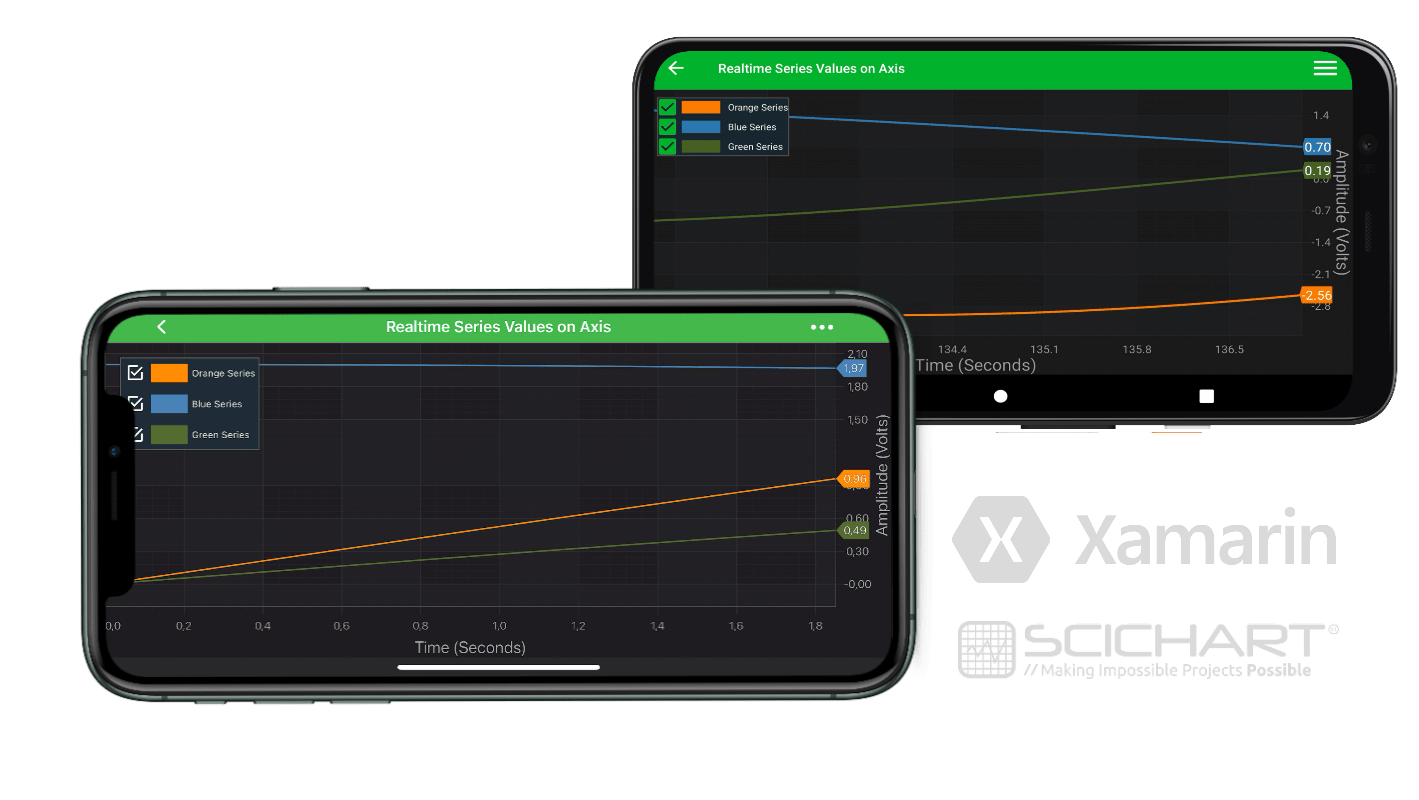
This example demonstrates how to use the series value modifier with Xamarin in SciChart. It is a very popular feature for the Financial and Trading applications as this allows you to alwasy see the latest value on a screen, no matter where you scrolled or zoomed in to.
The C#/Xamarin.iOS/Xamarin.Android source code for the Xamarin Series Value Modifier Example is included below (Scroll down!).
Did you know you can also view the source code from one of the following sources as well?
using System;
using SciChart.iOS.Charting;
using System.Timers;
using UIKit;
namespace Xamarin.Examples.Demo.iOS
{
[ExampleDefinition("Realtime Series Values on Axis", description: "Demonstrates usage of the SCISeriesValueModifier", icon: ExampleIcon.RealTime)]
public class UsingSeriesValueModifierViewController : SingleChartViewController<SCIChartSurface>
{
private const int FifoCapacity = 100;
private const double TimerInterval = 20;
private const double OneOverTimeInteval = 1.0 / TimerInterval;
private Timer _timer;
private double _t = 0;
private readonly XyDataSeries<double, double> _ds1 = new XyDataSeries<double, double> { FifoCapacity = FifoCapacity, SeriesName = "Orange Series" };
private readonly XyDataSeries<double, double> _ds2 = new XyDataSeries<double, double> { FifoCapacity = FifoCapacity, SeriesName = "Blue Series" };
private readonly XyDataSeries<double, double> _ds3 = new XyDataSeries<double, double> { FifoCapacity = FifoCapacity, SeriesName = "Green Series" };
protected override void InitExample()
{
var xAxis = new SCINumericAxis
{
AutoRange = SCIAutoRange.Always,
AxisTitle = "Time (Seconds)",
TextFormatting = "0.0"
};
var yAxis = new SCINumericAxis
{
AutoRange = SCIAutoRange.Always,
AxisTitle = "Amplitude (Volts)",
GrowBy = new SCIDoubleRange(0.1, 0.1),
TextFormatting = "0.00",
CursorTextFormatting = "0.00"
};
var rSeries1 = new SCIFastLineRenderableSeries { DataSeries = _ds1, StrokeStyle = new SCISolidPenStyle(0xFFFF8C00, 2f) };
var rSeries2 = new SCIFastLineRenderableSeries { DataSeries = _ds2, StrokeStyle = new SCISolidPenStyle(0xFF4682B4, 2f) };
var rSeries3 = new SCIFastLineRenderableSeries { DataSeries = _ds3, StrokeStyle = new SCISolidPenStyle(0xFF556B2F, 2f) };
using (Surface.SuspendUpdates())
{
Surface.XAxes.Add(xAxis);
Surface.YAxes.Add(yAxis);
Surface.RenderableSeries.Add(rSeries1);
Surface.RenderableSeries.Add(rSeries2);
Surface.RenderableSeries.Add(rSeries3);
Surface.ChartModifiers.Add(new SCILegendModifier { Margins = new UIEdgeInsets(16, 16, 16, 16)});
Surface.ChartModifiers.Add(new SCISeriesValueModifier());
}
Start();
}
private void Start()
{
_timer = new Timer(TimerInterval);
_timer.Elapsed += OnTick;
_timer.AutoReset = true;
_timer.Start();
}
private void OnTick(object sender, ElapsedEventArgs e)
{
InvokeOnMainThread(() =>
{
var y1 = 3.0 * Math.Sin(((2 * Math.PI) * 1.4) * _t * 0.02);
var y2 = 2.0 * Math.Cos(((2 * Math.PI) * 0.8) * _t * 0.02);
var y3 = 1.0 * Math.Sin(((2 * Math.PI) * 2.2) * _t * 0.02);
_ds1.Append(_t, y1);
_ds2.Append(_t, y2);
_ds3.Append(_t, y3);
_t += OneOverTimeInteval;
});
}
public override void ViewDidDisappear(bool animated)
{
base.ViewDidDisappear(animated);
Reset();
}
private void Reset()
{
_timer.Stop();
_timer.Elapsed -= OnTick;
_timer = null;
using (Surface.SuspendUpdates())
{
_t = 0;
_ds1.Clear();
_ds2.Clear();
_ds3.Clear();
}
}
}
}
using System;
using System.Timers;
using Android.Views;
using SciChart.Charting.Model.DataSeries;
using SciChart.Charting.Modifiers;
using SciChart.Charting.Visuals;
using SciChart.Charting.Visuals.Axes;
using SciChart.Charting.Visuals.RenderableSeries;
using SciChart.Data.Model;
using SciChart.Drawing.Common;
using Xamarin.Examples.Demo.Droid.Extensions;
using Xamarin.Examples.Demo.Droid.Fragments.Base;
namespace Xamarin.Examples.Demo.Droid.Fragments.Examples
{
[ExampleDefinition("Realtime Series Values on Axis", description: "Demonstrates usage of the SCISeriesValueModifier", icon: ExampleIcon.RealTime)]
public class UsingSeriesValueModifierFragment : ExampleBaseFragment
{
private const int FifoCapacity = 100;
private const long TimerInterval = 20;
private const double OneOverTimeInteval = 1.0 / TimerInterval;
public override int ExampleLayoutId => Resource.Layout.Example_Single_Chart_Fragment;
private SciChartSurface Surface => View.FindViewById<SciChartSurface>(Resource.Id.chart);
private readonly XyDataSeries<double, double> _ds1 = new XyDataSeries<double, double> { FifoCapacityValue = FifoCapacity, SeriesName = "Orange Series" };
private readonly XyDataSeries<double, double> _ds2 = new XyDataSeries<double, double> { FifoCapacityValue = FifoCapacity, SeriesName = "Blue Series" };
private readonly XyDataSeries<double, double> _ds3 = new XyDataSeries<double, double> { FifoCapacityValue = FifoCapacity, SeriesName = "Green Series" };
private double _t = 0;
private readonly object _syncRoot = new object();
private Timer _timer;
protected override void InitExample()
{
var xAxis = new NumericAxis(Activity)
{
AutoRange = AutoRange.Always,
AxisTitle = "Time (Seconds)",
TextFormatting = "0.0"
};
var yAxis = new NumericAxis(Activity)
{
AutoRange = AutoRange.Always,
AxisTitle = "Amplitude (Volts)",
GrowBy = new DoubleRange(0.1, 0.1),
TextFormatting = "0.00",
CursorTextFormatting = "0.00"
};
var rs1 = new FastLineRenderableSeries { DataSeries = _ds1, StrokeStyle = new SolidPenStyle(0xFFFF8C00, 2f.ToDip(Activity)) };
var rs2 = new FastLineRenderableSeries { DataSeries = _ds2, StrokeStyle = new SolidPenStyle(0xFF4682B4, 2f.ToDip(Activity)) };
var rs3 = new FastLineRenderableSeries { DataSeries = _ds3, StrokeStyle = new SolidPenStyle(0xFF556B2F, 2f.ToDip(Activity)) };
var legendModifier = new LegendModifier(Activity);
legendModifier.SetLegendPosition(GravityFlags.Top | GravityFlags.Left | GravityFlags.Bottom | GravityFlags.Right, 16);
using (Surface.SuspendUpdates())
{
Surface.XAxes.Add(xAxis);
Surface.YAxes.Add(yAxis);
Surface.RenderableSeries.Add(rs1);
Surface.RenderableSeries.Add(rs2);
Surface.RenderableSeries.Add(rs3);
Surface.ChartModifiers.Add(legendModifier);
Surface.ChartModifiers.Add(new SeriesValueModifier());
}
Start();
}
private void Start()
{
_timer = new Timer(TimerInterval);
_timer.Elapsed += OnTick;
_timer.AutoReset = true;
_timer.Start();
}
private void OnTick(object sender, ElapsedEventArgs e)
{
lock (_syncRoot)
{
var y1 = 3.0 * Math.Sin(((2 * Math.PI) * 1.4) * _t * 0.02);
var y2 = 2.0 * Math.Cos(((2 * Math.PI) * 0.8) * _t * 0.02);
var y3 = 1.0 * Math.Sin(((2 * Math.PI) * 2.2) * _t * 0.02);
_ds1.Append(_t, y1);
_ds2.Append(_t, y2);
_ds3.Append(_t, y3);
_t += OneOverTimeInteval;
}
}
public override void OnDestroyView()
{
base.OnDestroyView();
Reset();
}
private void Reset()
{
_timer.Stop();
_timer.Elapsed -= OnTick;
_timer = null;
using (Surface.SuspendUpdates())
{
_t = 0;
_ds1.Clear();
_ds2.Clear();
_ds3.Clear();
}
}
public override void InitExampleForUiTest()
{
base.InitExampleForUiTest();
lock (_syncRoot)
{
Reset();
var random = new Random(42);
for (var i = 0; i < FifoCapacity; i++)
{
lock (_syncRoot)
{
var y1 = 3.0 * Math.Sin(((2 * Math.PI) * 1.4) * _t * 0.02);
var y2 = 2.0 * Math.Cos(((2 * Math.PI) * 0.8) * _t * 0.02);
var y3 = 1.0 * Math.Sin(((2 * Math.PI) * 2.2) * _t * 0.02);
_ds1.Append(_t, y1);
_ds2.Append(_t, y2);
_ds3.Append(_t, y3);
_t += OneOverTimeInteval;
}
}
}
}
}
}