SciChart’s Cross-Platform Vision Complete!
SciChart has achieved a great deal in the past year, notably the pace of large releases has really increase in […]
I wanted to write an article about what goes on behind the scenes here at SciChart about how we handle support, prioritize features for development and generally be transparent about our management processes! A few months ago we turned off the forums, and while we replaced chaotic forum and email support where tasks got buried or lost altogether with a much better ticket-based system, we did lose something – transparency – of what we are working on and how we are handling your requests.
Here at SciChart we do like to be open and honest. You, our customers are almost like our investors. When you purchase licenses you are literally funding current and future development, so we want to give you a return on investment by giving you the features and support you need. But how do we actually decide that?
The first step is we try to follow the Support Workflow. We receive support requests all the time. Since the Forums were turned off and support.scichart.com went live, we received over 500 tickets in the first 2 months! You can appreciate there’s a high level of demand here and we are kept busy by support.
The workflow we follow for support handling is below:

Basically, it this is –
We typically get asked about things that SciChart does not support, or only supports via workaround. E.g. there are very few questions about the core features as demonstrated in our 100+ Live WPF Chart Examples or documented in our Knowledgebase. This tells us that we do a good job on demonstrating our core features and documenting them via the knowledgebase. If there’s something you need, it is usually something that is at the fringe of our feature-set, or something complex, so we are doing something right!
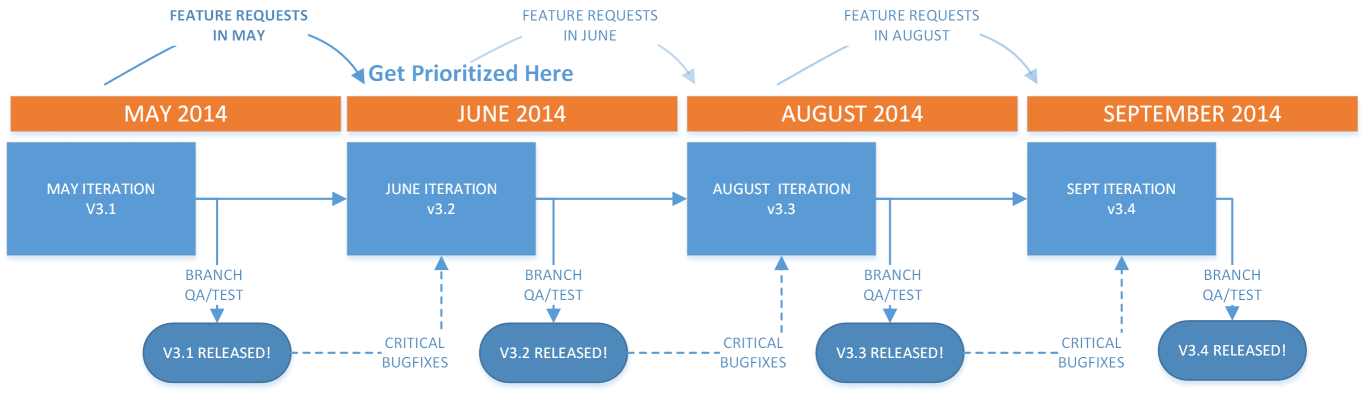
We currently run releases Month to Month. Meaning, we are aiming to release a minor update each and every month-end with the fixes and features you have requested in the previous month(s). This is in parallel with longer term R&D and major releases too!
After a while our monthly releases become hotfix releases, e.g. just critical bugs. For example, for SciChart v2.x this occurred after approximately 4 months of monthly releases. This frees us up to focus more on the major releases in the future. For instance, for the next few releases (SciChart v3.1, 3.2, 3.3), we plan a number of feature improvements as well as bug fixes that you report. After this time, we may opt to scale back on features and focus more on bugs as we do deeper refactors in-parallel for the next step-change in functionality.
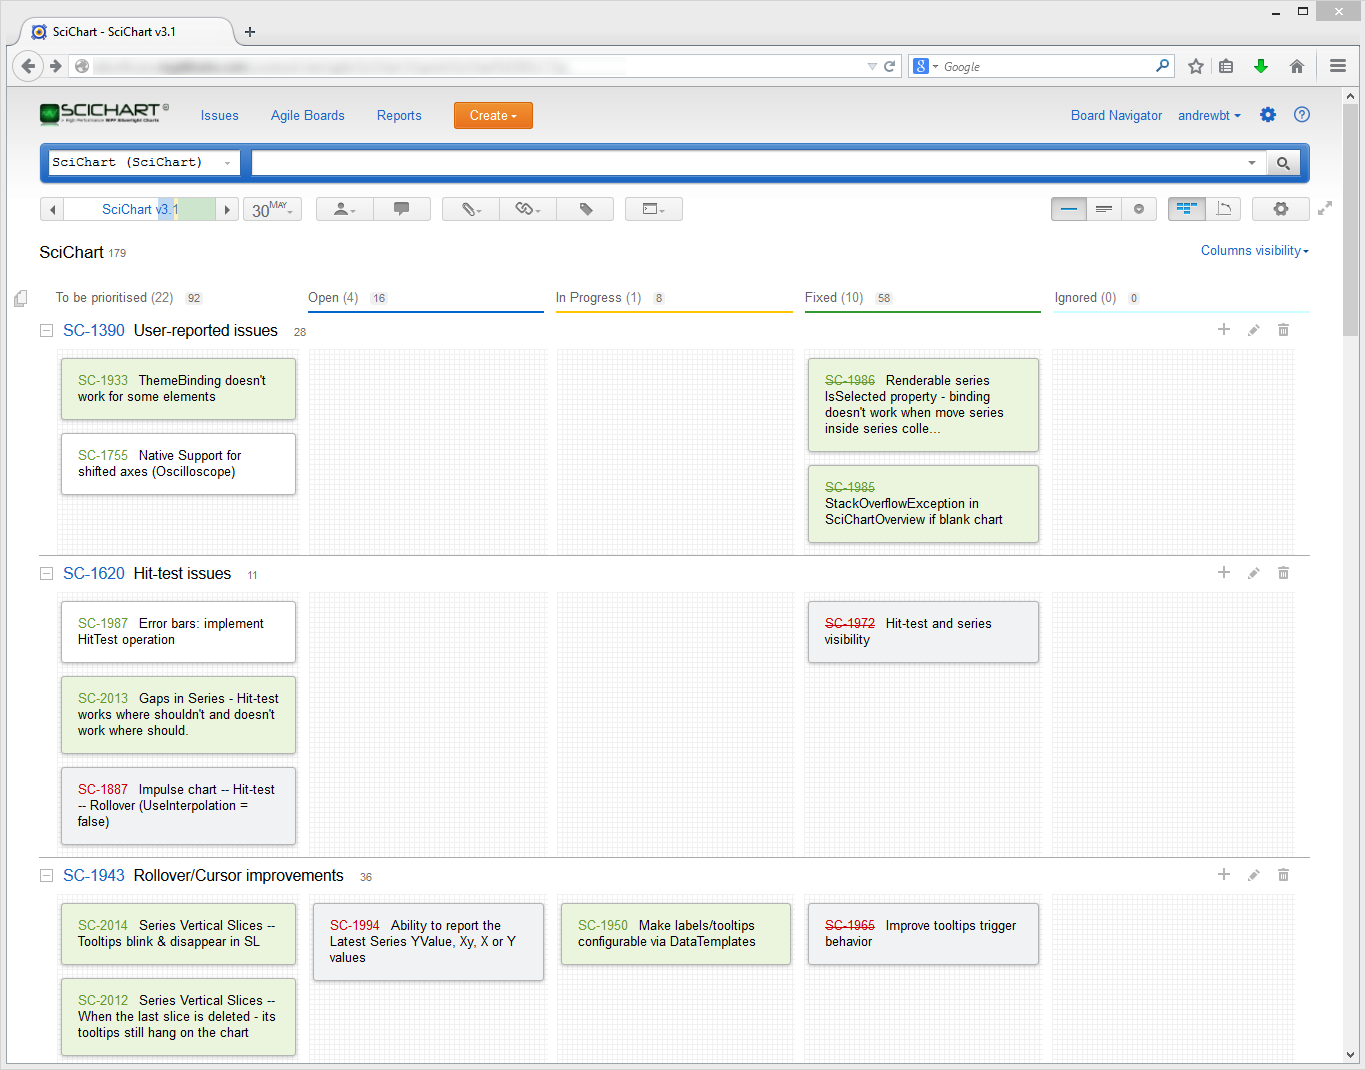
We use the brilliant JetBrains Youtrack to track issues and manage iterations in an Agile fashion. YouTrack is an Agile Project Management tool. Whenever we create a Feature Request or Task in our issue tracker, it goes into the issue tracker:
Work is divided into Iterations, and we have chosen a month as our iteration cycle length. At the end of each iteration, our code is branched, goes through QA, final bug fixing, testing and is released. Any bugs found or fixed during QA or after are merged back into the main branch.
We are following Trunk Based Development and all our main development is done off Trunk. e.g. Trunk is unstable, and every release becomes a branch. Bug-fixing, QA and testing is done on the branch. After release, the branch is merged back into Trunk. Sometimes Feature Branches are created but we aim to keep our code Always Releasable.
Using the issue tracker, we can also track progress. Here you can find a screenshot of the v3.1 iteration (May 2014), showing our progress (Orange) vs. expected (Blue). As you can see, we’re tracking quite closely. Once we get near the end of an iteration, we can either extend the release date, or drop features and move to the next release.
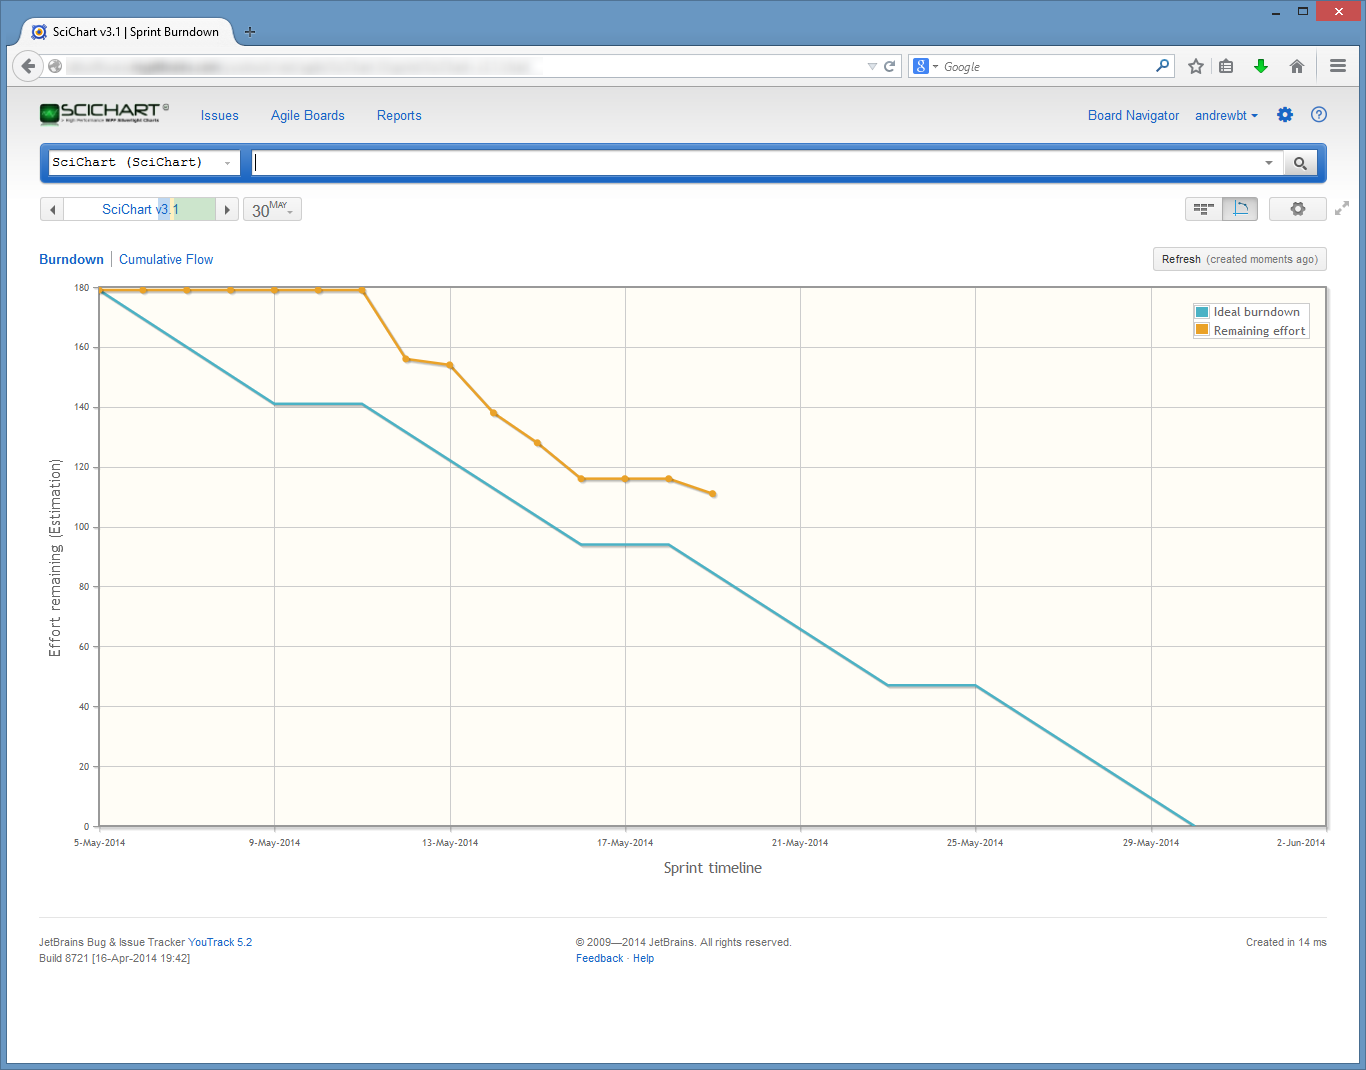
As you can see above we’re not far off schedule! Overruns can be handled in two ways:
Under no circumstances is release poor-quality software on-time a part of the options above ;-)
The actual features and fixes for v3.1 or any iteration won’t be announced until release time. Sometimes a feature has to be backed out at the last minute because quality is not high enough, so we don’t like to announce ahead of time. We take care that every release is of high quality. We don’t want to ruin our hard-won reputation as the Best WPF Chart by releasing shoddy software or by doing a poor job on support. So, great care is taken that each feature works, is tested and documented, either by KB article, release note or example.
We prefer to document by example as its live, you can see it, play with it, we can test-it each release, you can browse the source-code and it never gets out of date (you’ll never get a compilation error from out of date docs).
So there’s a feature you need but SciChart doesn’t support it yet? We decide our roadmap based on the following ranking:
From time to time, one of our clients approaches us to sponsor a feature. This means we accelerate the development of a feature in return for an hourly or daily rate for ‘time and materials’ work, which is budgeted for and agreed in advance.
Our rates for such work are below. This is set to reflect the nature of demand and to encourage only the most urgent features from our customers.
If you’re thinking this, then this service is probably not for you! We have a roadmap and we do use your requests to form the roadmap, but sometimes a feature, which is simply unpopular relative to current demand, gets deprioritized. If you really need it and soon then Feature Sponsorship is for you.
Ultimately we cannot say without hearing your requirements, so if you are interested in this service, then please contact-us and we will give you an estimate.
In any case we know SciChart better than anyone else and can significantly short-cut your development time by helping you with customizations to the Chart.
Related Posts
![]()
Queens Award for Innovation
Proud winners of the Queens Award for Innovation, 2019. Awarded on account of our innovative graphics engine which underpins the SciChart library and enables our world-beating charting performance
![]()
National Business Awards
Highly Commended for Lloyds National Business Awards, 2019. Awarded on account of our innovative graphics engine and impressive customer base
![]()
National Technology Awards
Awarded “Healthcare Tech of the Year” at the 2025 National Technology Awards – a top UK recognition for breakthrough innovation in technology.

Reviews
SciChart has received hundreds of verified, 3rd party reviews