SciChart® the market leader in Fast WPF Charts, WPF 3D Charts, and now iOS Charting & Android Chart Components
SciChart® the market leader in Fast WPF Charts, WPF 3D Charts, and now iOS Charting & Android Chart Components
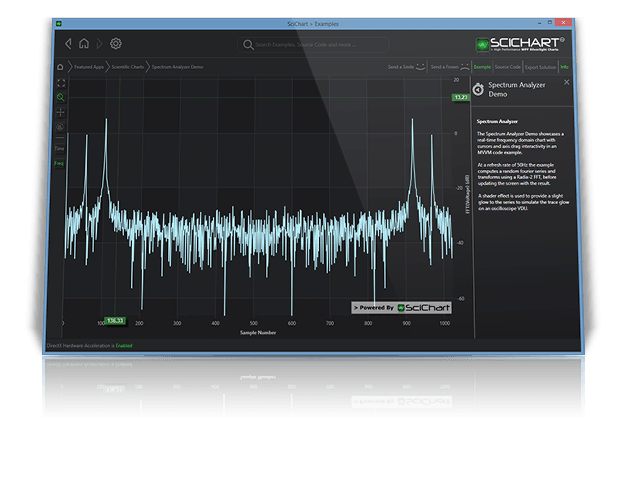
High Performance Real-time WPF Chart Control for Scientific, Medical Engineering and Finance
DOWNLOAD FREE TRIAL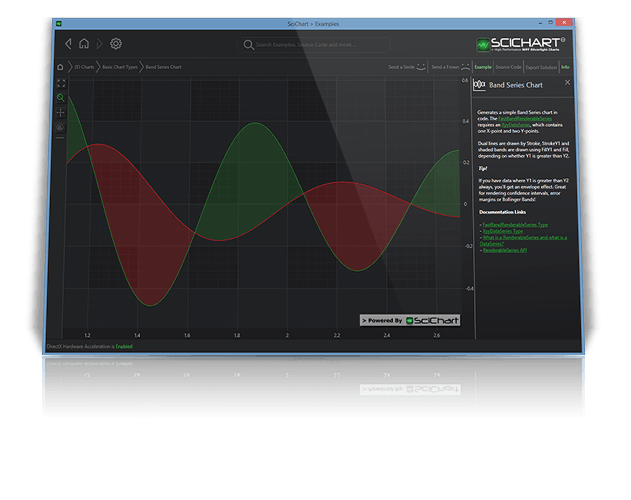

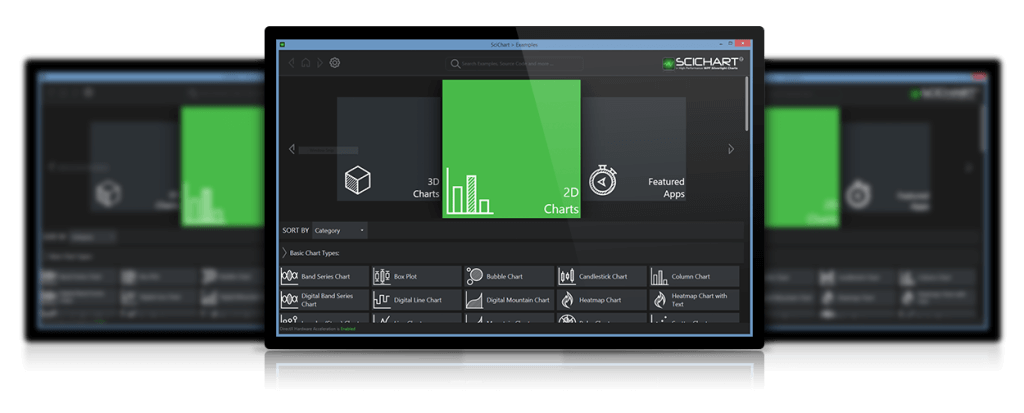
SciChart for WPF v4 contains 25 WPF Chart types with record performance, unlimited multiple X/Y axis, interactive zooming and panning and rich annotations API. With so many options to choose from, plus our legendary WPF Charting performance and helpful tech support, it’s not hard to see why we’re number #1!
With many Chart-Types to choose from, plus the potential to extend infinitely via our flexible DirectX-powered rendering engine, you’ll be spoilt for choice with SciChart’s WPF Charts!
WPF Band (High Low Fill) Chart
WPF Box Plot Chart
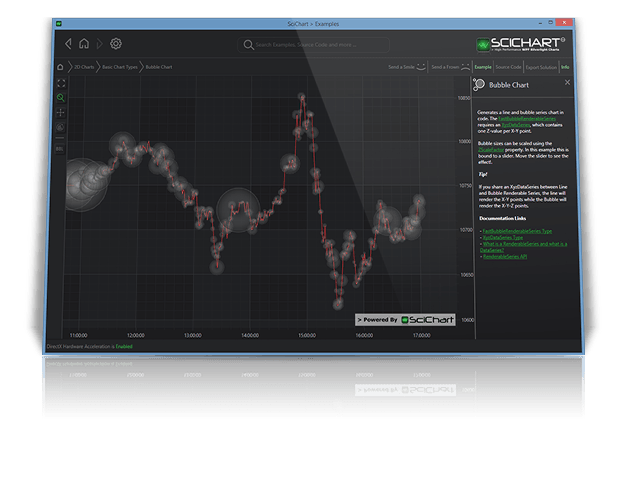
WPF Bubble Chart
WPF Candlestick Chart
WPF Column Chart
WPF Digital Band (High Low Fill) Chart
WPF Digital Line Chart
WPF Digital Mountain Chart
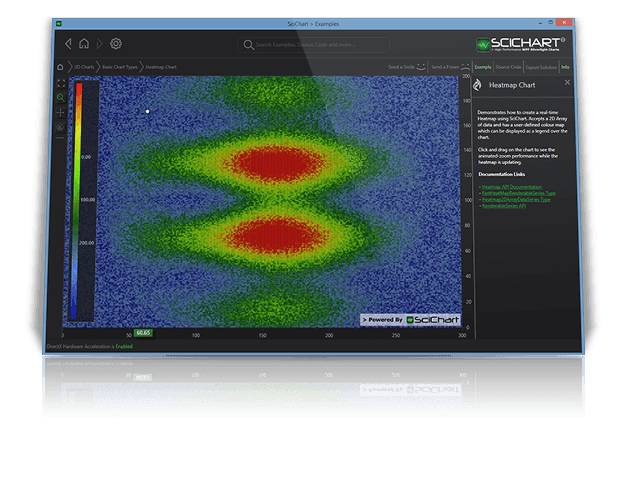
WPF Heatmap / Spectrogram Chart
WPF Error Bars Chart
WPF Impulse (Stem) Chart
WPF Line Chart
WPF Mountain (Area) Chart
WPF OHLC Chart
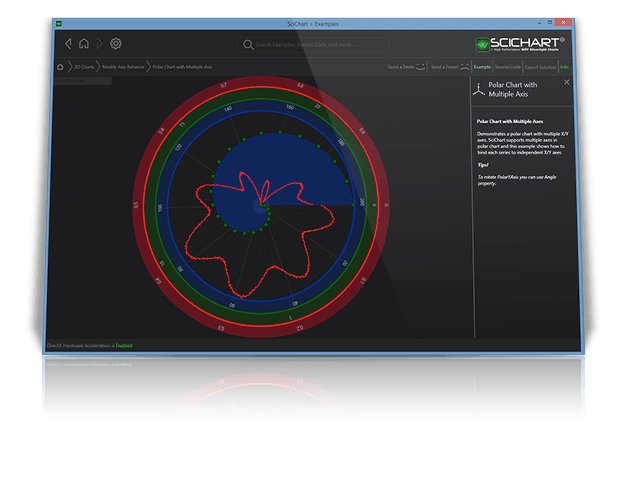
WPF Polar Chart
WPF Scatter Chart
WPF Scatter Line Chart
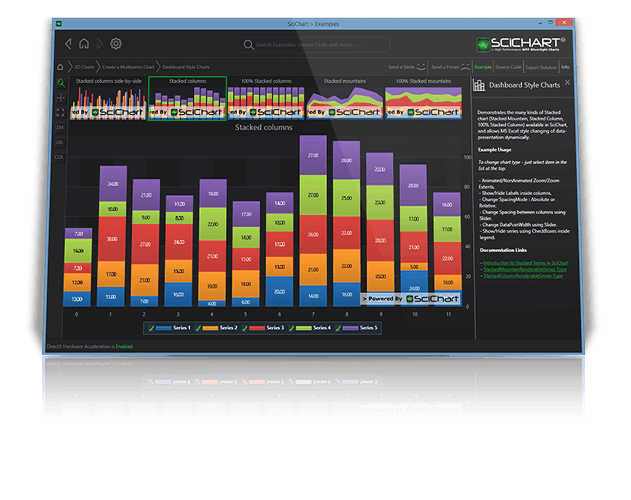
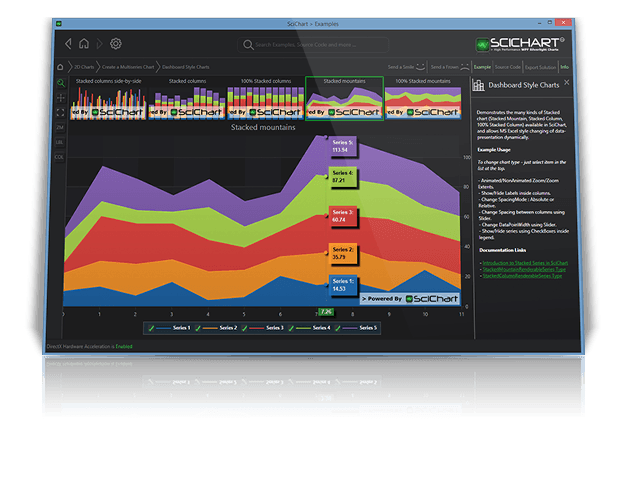
WPF Stacked Column Chart
WPF Stacked Mountain Chart
WPF Stacked Bar Chart
WPF 100% Stacked Mountain Chart
WPF 100% Stacked Column Chart
WPF Fan Chart
WPF Spline Line Chart (via workaround)
WPF Custom Renderable Series
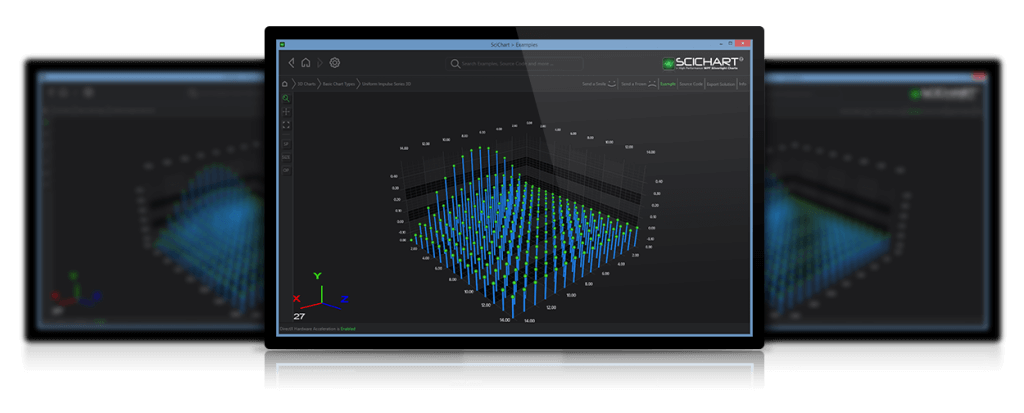
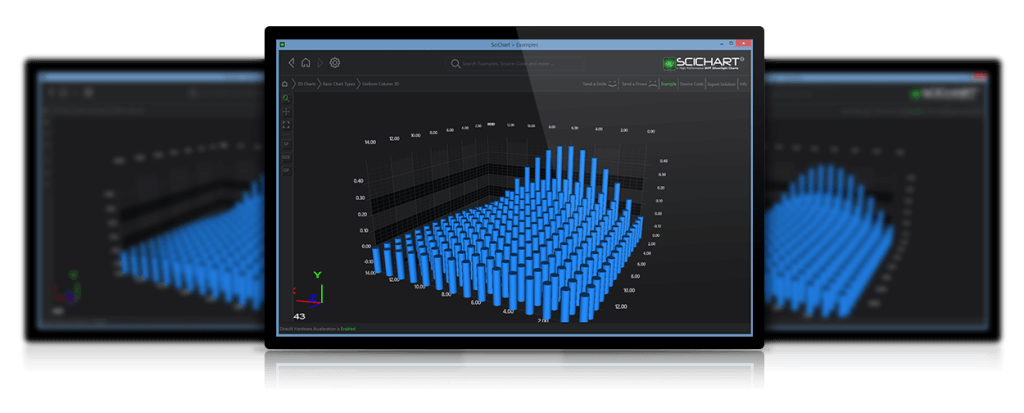
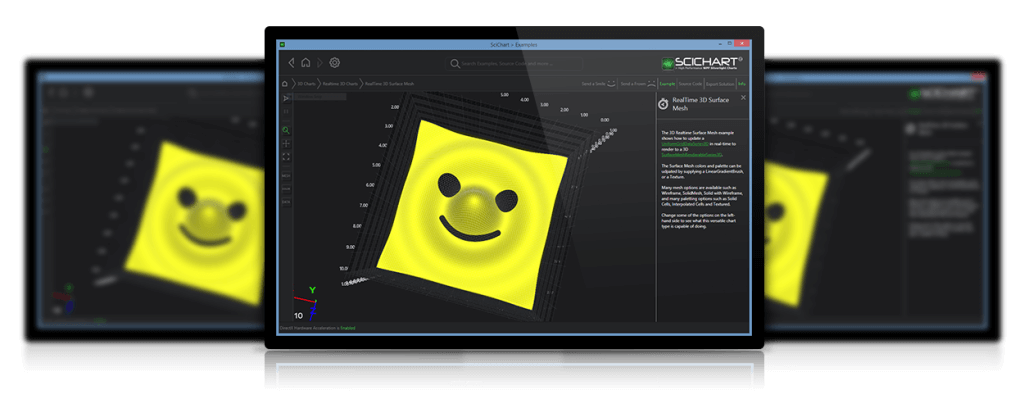
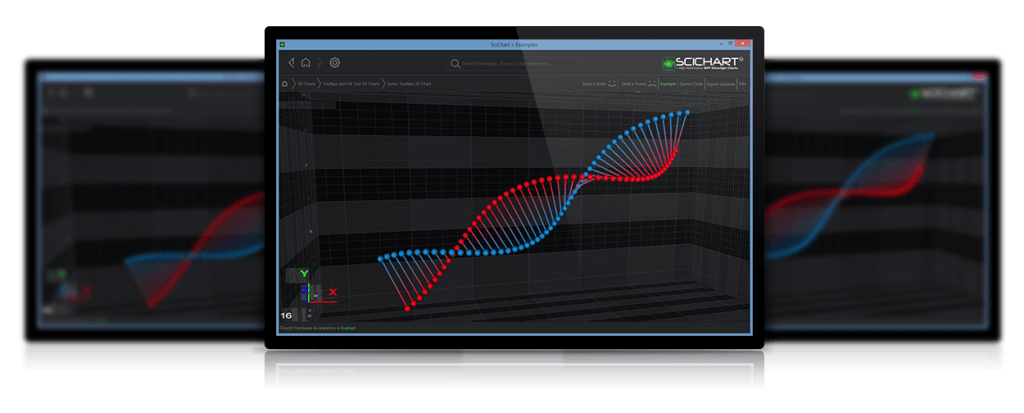
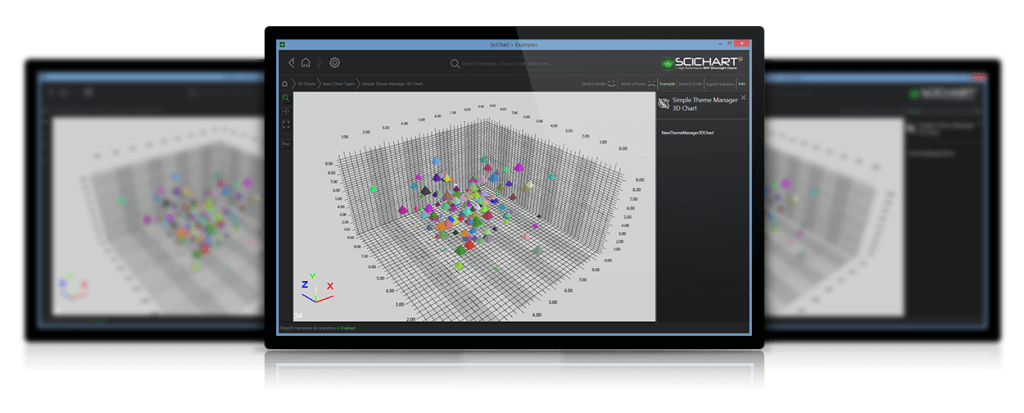
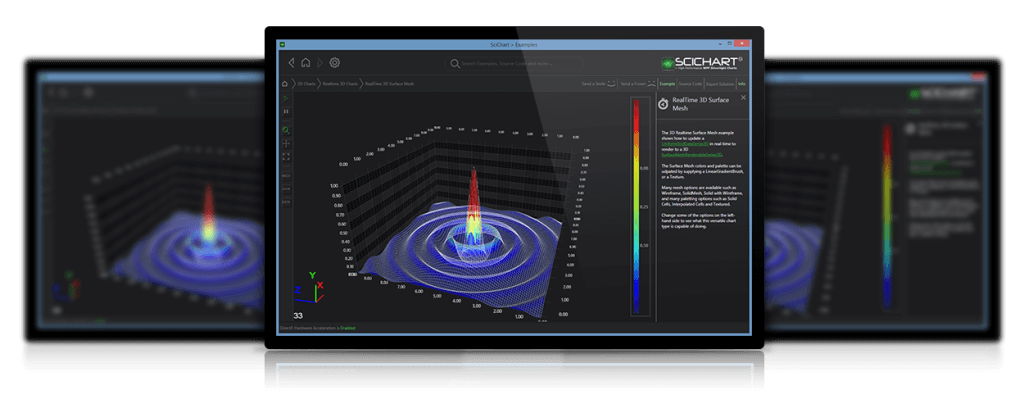
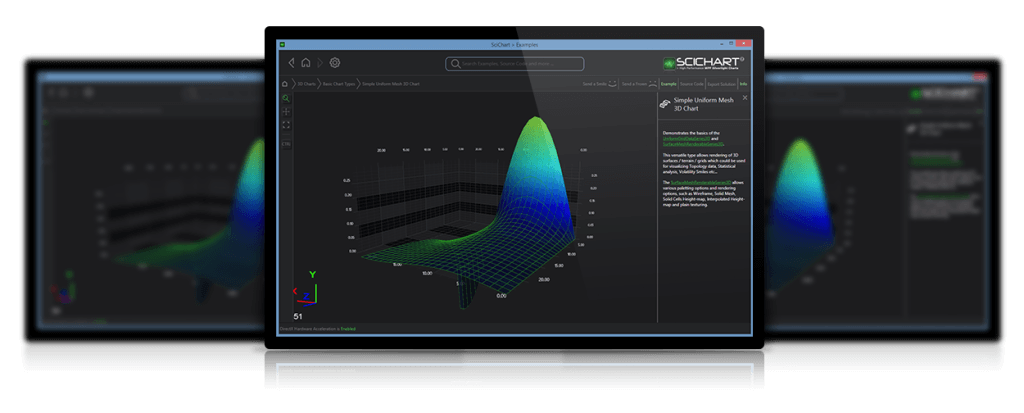
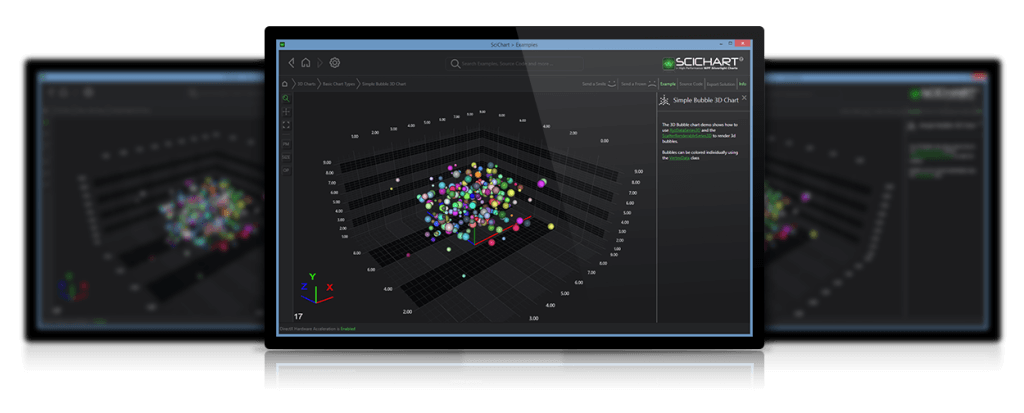
As of SciChart v4 we now support DirectX powered WPF 3D Chart Controls including Real-time WPF 3D Surface Mesh Chart, WPF 3D Point-Cloud Chart, WPF 3D Scatter Chart, WPF 3D Bubble Chart, 3D Column Chart and more … Our WPF 3D Charts are both real-time and interactive and allow zooming, panning, rotating of a 3D scene seamlessly inside a WPF Charting application, all using declarative XAML and MVVM as WPF was intended to be used.

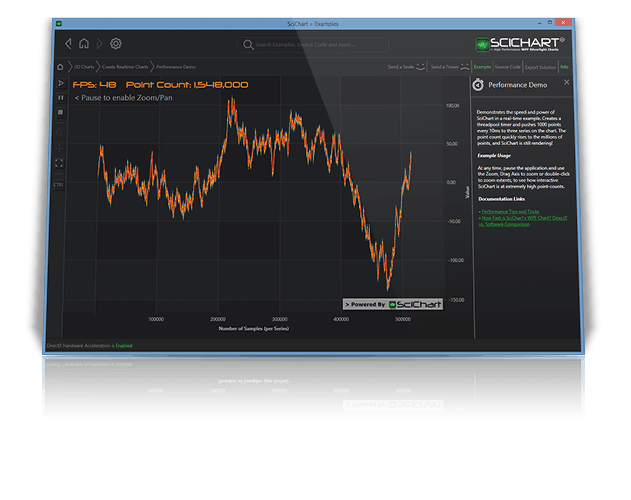
Our legendary WPF Charting performance is achieved by a mixture of extensive end-to-end performance optimisations, C# unsafe code, DirectX drawing (with fall-back to software) and intelligent culling / resampling / data transformation algorithms. You just won’t find real-world WPF Chart performance quite like SciChart!
With SciChart, it is now possible to display 10,000,000+ point line-charts, 1,000,000+ point scatter charts, or 1,000,000+ bar candlestick charts and update in real-time. It’s also possible to display thousands of series, or hundreds of WPF Charts on a single UI without stalling the rest of your user interface.
Read Performance Benchmarks
SciChart’s WPF Chart API has been refined over four years with feedback from thousands of developers and end-users. Our WPF Chart API has amazingly rich features which allow for customisation and extensibility
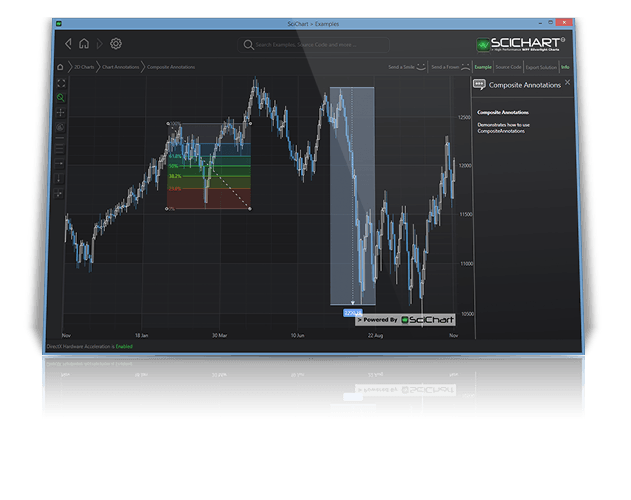
Rich, Interactive Annotations API
Absolute Placement at X,Y Data Values, SciChart Updates Positions Automatically
Relative Placement e.g. Top 5%, Left 10%
Line Annotation
Line Arrow Annotation
Box Annotation
Textbox / Label
Vertical Line with Axis Value
HorizontalLine with Axis Value
Custom Annotation for any UIElement
Fibonacci Retracement
Measure Peak to Peak / Cycle Duration
Composite Custom Annotation API
Supports Templating and Styling
Placement Above or Below the chart
Optional Dragging / Resizing via mouse
Showing / Hiding via MVVM or in Code
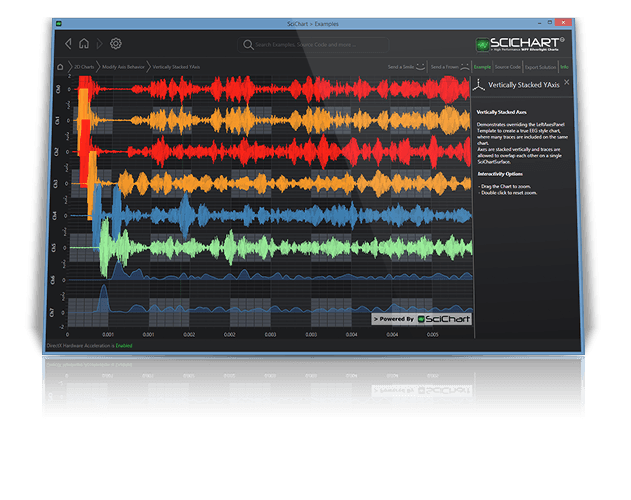
Unlimited, Multiple X,Y Axis
Axis Placement Customisation (Left, Top, Right, Bottom, Centre)
Customize Label Formatting, Positioning, Placement
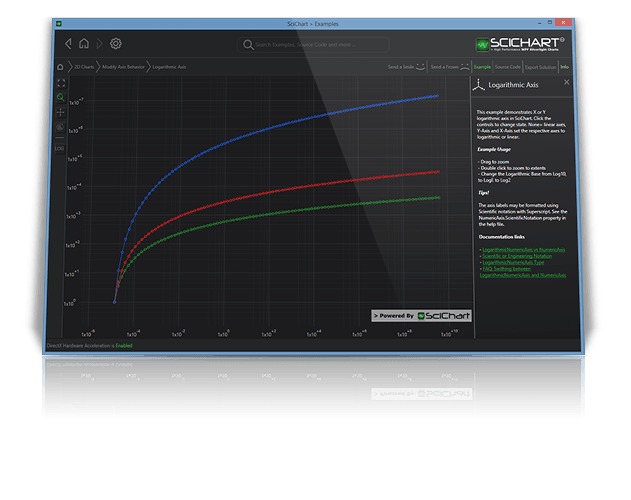
Numeric, Logarithmic, DateTime, Category and TimeSpan Axis Types
Templatable Axis Titles and Labels
Rotate Axis Labels
Toggle Gridlines, Ticks and Bands On or Off
Style Axis Borders, Gridlines, Ticks and Labels
Polar Axis Type
Horizontal or Vertical Charts for Oil & Gas Industry
Synchronize Axis Sizes across Charts
Scientific or Engineering Notation
Programmatic Axis Pixel-Data Conversion API
Crosshairs which tracks the mouse with Axis Labels and optional Tooltips
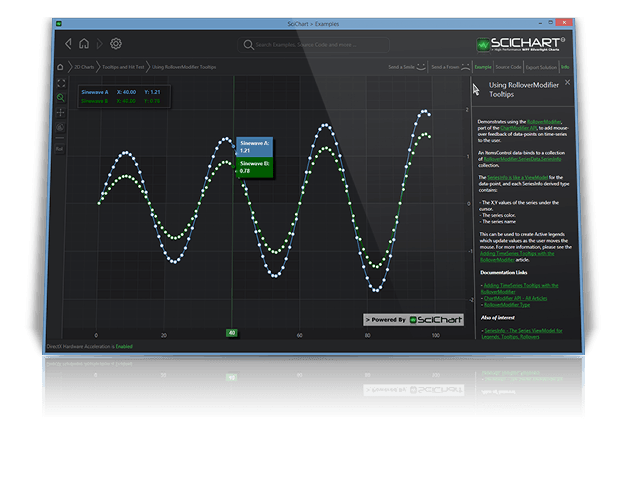
Rollover (Vertical line which tracks the mouse) with Hoverable Trackballs and active legends
Templatable, Customisable Tooltips on Hover.
Drag & Position Vertical Lines which slice your data and show tooltips on series intersection
Showing Latest Series Values on the YAxis
Templatable, Active Chart Legends
Pass Business-objects (Metadata) through to Tooltips
Style Tooltips according to your application style
MVVM Friendly SeriesBinding which binds to Chart Series ViewModels
Comprehensive set of ViewModels for each built in Chart-Type
Add/Remove or Chart Series via MVVM or Code
Dynamically Add/Remove Axis via MVVM or Code
Change Chart Type or Styling Properties via MVVM or Code
Manipulate Data in ViewModels and get automatic updates on the Chart
Trigger Redraw from MVVM or code
Control whether Zoom/Pan Behaviour is enabled from MVVM or code.
Bind Tooltips to Business Objects via the Point Metadata API
FAST Immediate-Mode, bitmap powered rendering in WPF
High Quality (CPU), High Speed (CPU), DirectX (GPU) and Vector (CPU) Rasterizer Plugins
Fallback from DirectX to software if GPU not available
Renders over Remote desktop and Screen Share
High Quality Bitmap and Vector Export
AntiAliasing On/Off per series
Color points individually with PaletteProvider API
Gradient Fills on Mountain, Column, Candlestick Types
Color Fills and Strokes
Dashed Lines with StrokeDashArray
Render null/empty points with Double.NaN
Set line StrokeThickness
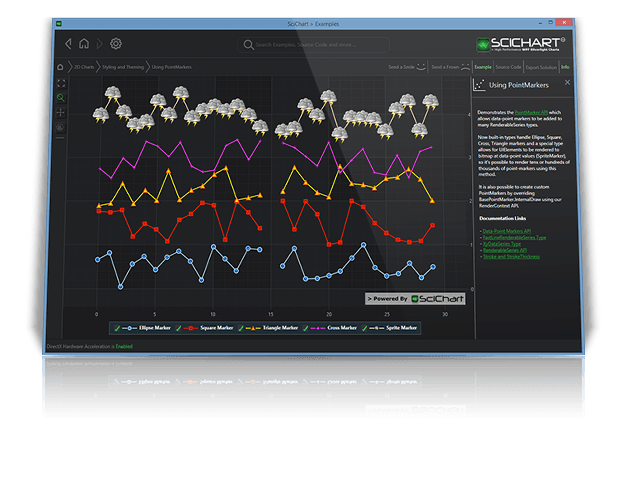
Data-point Markers: Ellipse, Cross, Triangle, Square, Custom
Access to our RenderContext API to draw your own series, bands and markers
Hit-Test API for mouse click/hover of series, points.
Rich ChartModifier API for overriding MouseDown, MouseMove, MouseUp, Touch behaviours on the chart
Data-point Selection programmatically or via the mouse
Series-selection programmatically or via the mouse
Nearest point to mouse / Is Over point via Hit-Test API
Series Values under the mouse via the Rollover API
8 Stunning Themes to choose from
Create Custom Themes easily
Override Properties in XAML, e.g. Background, Gridlines, Text Color, Series Stroke and Fill
XAML Styling for Chart components, RenderableSeries, Tooltips, Legends and more
WPF-Friendly, Templatable API
Create Stunning looking Charts with Modern Styles!
Drag a rectangle to animate-zoom
Scroll via Axis Drag
Mousewheel to zoom
Double-click to animate zoom extents
Pan horizontally or vertically via mouse-drag
Synchronize Mouse across charts
Scrollbars and Overview controls
Set or animate Axis VisibleRange programmatically or via MVVM
API to Programmatically pan or scale
Powerful custom ChartModifier API for developing custom mouse interactivity extensions
Zoom History (zoom undo/redo)
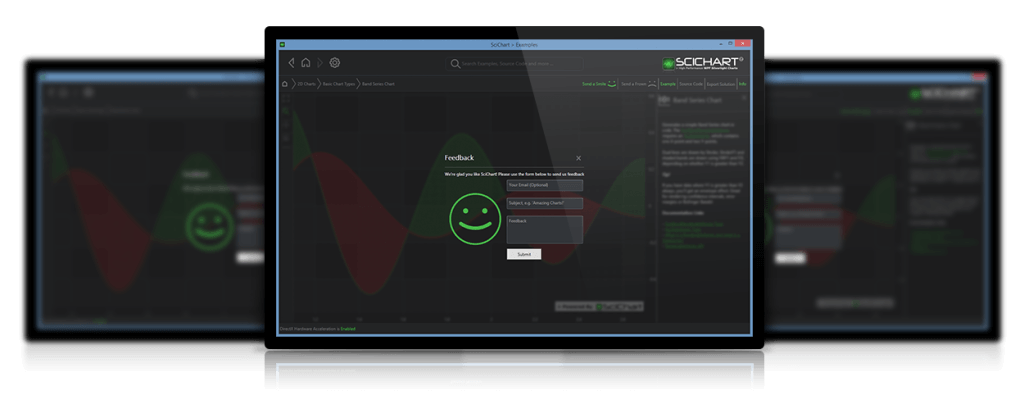
Our customers continually rate us the best at providing world-class tech support for our WPF Charts:
"Over the years I have submitted various support tickets to Telerik, Jetbrains, Microsoft, and SciChart, and i can confidently say from my experience that Scichart has the best level of support from any of these companies."
David Clark

"I'm impressed with the support of Scichart team, it was fast, reliable & the suggestions easy to implement. While I usually have a bitter taste about other providers, SciChart definitely has my best recommendations to my co-workers & friends."
Freddy Sarmiento
Rosen Group

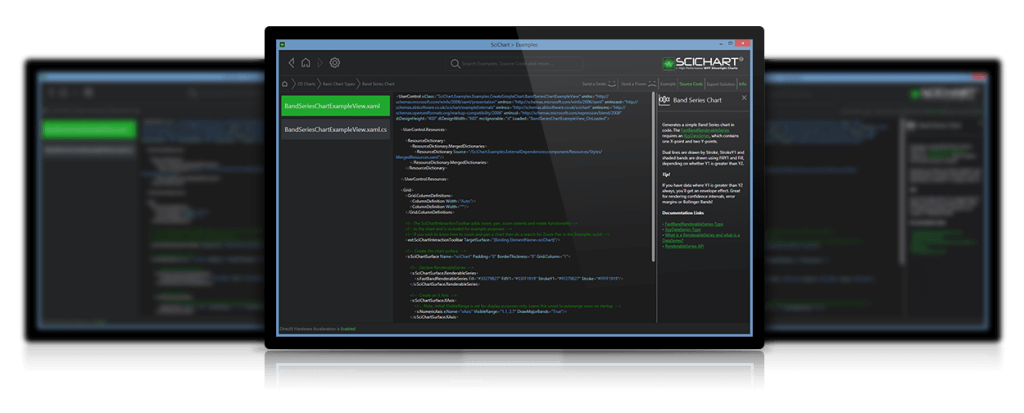
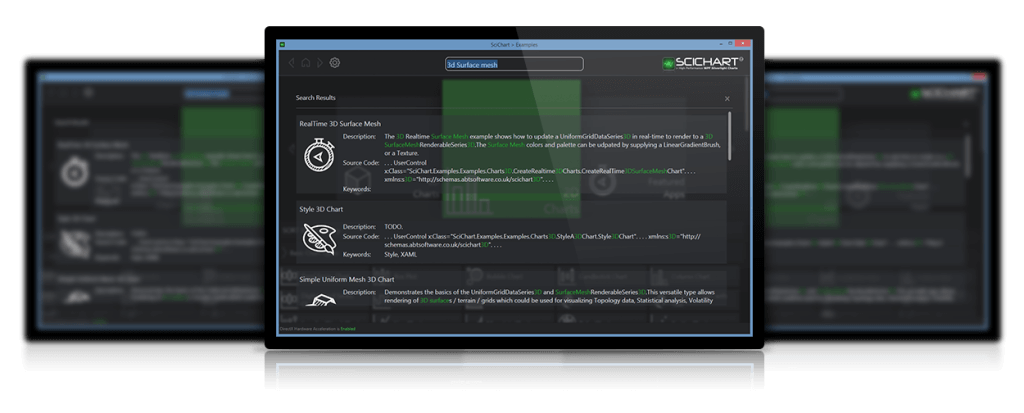
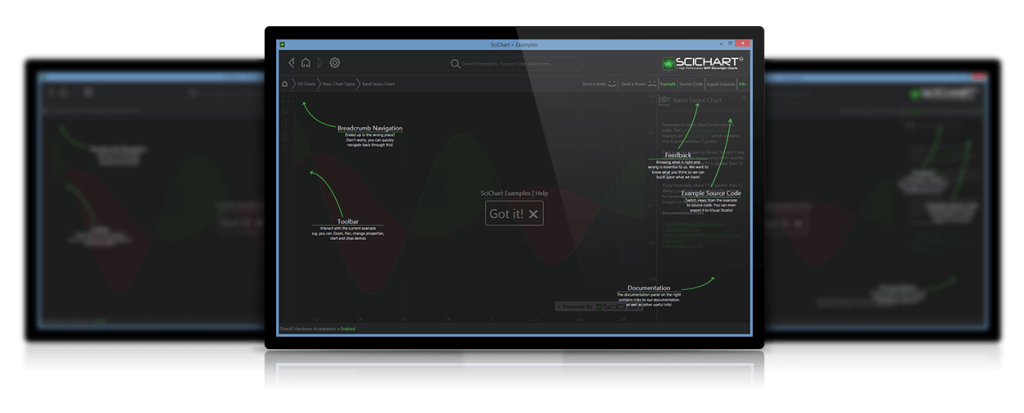
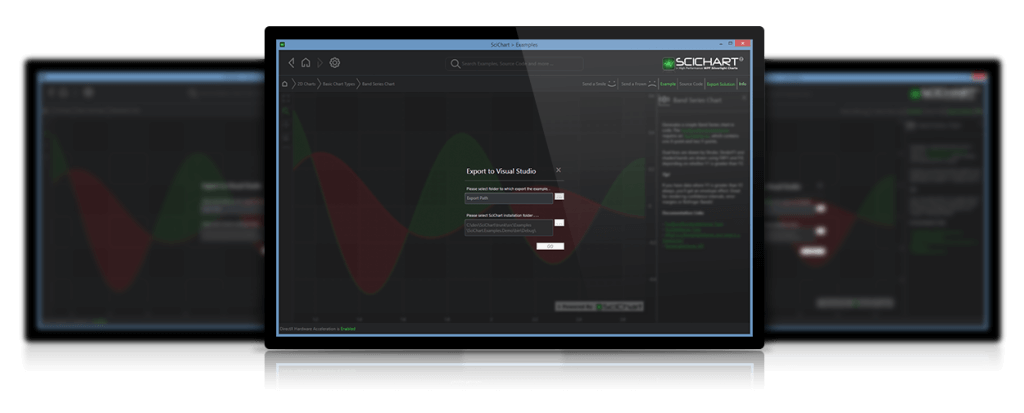
No other WPF Charting vendor supplies such comprehensive examples and documentation! Our examples suite contains over 100 live code examples which you can export to a stand-alone Visual Studio project straight away. SciChart WPF Charts are backed by 1,500 forum questions, 300+ pages of documentation as well as a knowledgeable and responsive development team to help you achieve the best from SciChart.
SciChart WPF Charts now have over 150,000 lines of code, covered by 3,600 unit and integration test and 7,500 checkins to version control over four years of development. We are the most actively developed WPF Chart control in the world and continue to add features and fix bugs/issues reported by our userbase.
Report a bug, sometimes we fix it same-day and push to NuGet / Github. If you’re a SciChart customer you can get the code changes within minutes and apply them to your build, allowing you to get on with your day to day business. How many can say that!
SciChart is trusted by thousands of developers worldwide and has customers in over 40 countries from sectors including Pharmaceutical, Oil & Gas, Medical, Instrumentation, Defence, Aerospace, Motorsport, Process Automation, Mining, Investment Banking, Trading and more.


SciChart’s WPF Charts are licensed on a perpetual, per-developer licensing model, with royalty free redistribution. You get access to the world’s best WPF Charts, starting from just $899 per developer license.