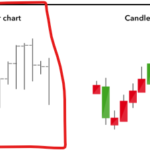
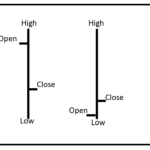
In financial markets, there is a type of chart that is as follows.
I did not find this type of chart in SciChart.
Please help me how to draw this chart
- Vahid Garousi asked 1 year ago
- last edited 1 year ago
- You must login to post comments
We call this an OHLC chart and yes you can do this in Scichart
Take a look at the Android OHLC Series documentation here.
Does that answer your question?
You might also be interested in the SciTrader Android SDK which is open source. Find details about it here.
Best regards,
Andrew
- Andrew Burnett-Thompson answered 1 year ago
- You must login to post comments
Yes it does. thank you
- Vahid Garousi answered 1 year ago
- last edited 1 year ago
- You must login to post comments
Please login first to submit.


