Now I using different library for displaing candles.
And have two different styles of candles.
An author of library that I using strongly recomended this one library.
And I try to port my app to SciChart.
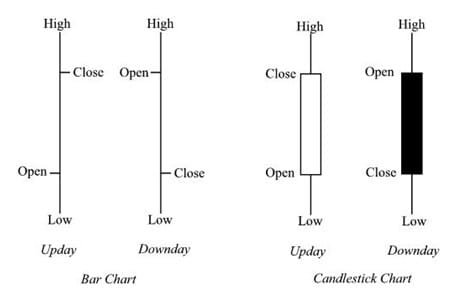
How can I change CandlestickSeries to displayed as a Bar Chart
Version
2.0.0.1654
Images


- Evgeny Khramov asked 6 years ago
- You must login to post comments
Hi Evgeny,
We have a separate series type which is called FastOhlcRenderableSeries which should provide desired output.
To implement switching you can create two renderable series ( candlestick and OHLC ) which share same data series instance and use setIsVisible() method to make one of them visible and other invisible:
    final IOhlcDataSeries<Date, Double> dataSeries = new OhlcDataSeries<>(Date.class, Double.class);

    // init series with shared dataSeries instance
    final FastCandlestickRenderableSeries candlestickSeries = sciChartBuilder.newCandlestickSeries().withDataSeries(dataSeries).build();
    final FastOhlcRenderableSeries ohlcSeries = sciChartBuilder.newOhlcSeries().withDataSeries(dataSeries).build();

    // make one series visible and other invisible
    candlestickSeries.setIsVisible(true);
    ohlcSeries.setIsVisible(false);
Hope that this will help you!
Best regards,
Yura
- Yura Khariton answered 6 years ago
 Thank you very much! This works great. I think problem is with sample CreateRealTimeTickingStockChartFragment I have seen this sample before but when I run sample on devise I do not see differents with CandlestickSeries I think you can zoom in this sample
- You must login to post comments
Your Answer
Please login first to submit.
