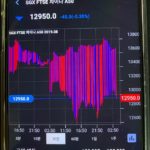
I’ve made a candle stick chart.
It is displayed correctly on data of 1 to 23 minute in time series.
But for data above 23 minute in time series, it is not displayed correctly.
I attach a screen shot.
I’ve looked through all the data on chart with debugging, the data are all correct.
But the candles of the chart is not consistent to the data.
For the data below 23 minute in time series, it is all right.
I could not find the problem from my code.
The following is a part of my code for setting data on the chart.
private void setChartData(SmChartData chart_data) {
try {
if (chart_data == null)
return;
        chartType = chart_data.chartType;
        chartCycle = chart_data.cycle;


        final IRange visibleRange = surface.getXAxes().get(0).getVisibleRange();

        if (getSeriesType() == SmSeriesType.CandleStick || getSeriesType() == SmSeriesType.Ohlc) {
            if (ohlcDataSeries != null) {
                ohlcDataSeries.clear();
                ohlcDataSeries.append(chart_data.getDate(), chart_data.getOpen(), chart_data.getHigh(), chart_data.getLow(), chart_data.getClose());
                visibleRange.setMinMaxDouble(0, ohlcDataSeries.getCount() - 1);


            }
        } else {
            if (xyDataSeries != null) {
                xyDataSeries.clear();
                xyDataSeries.append(chart_data.getDate(), chart_data.getClose());
                visibleRange.setMinMaxDouble(0, xyDataSeries.getCount() - 1);
            }
        }

        // 주문의 위치를 다시 찾아 준다.
        refreshOrderAnnotation();
    } catch (Exception e) {
        String msg = e.getMessage();
    }
}
What is the problem?
Please let me know why It is not display its candles correctly for some time series values.
Thank you very much.
- Shiwan Sung asked 5 years ago
- last edited 5 years ago
 Hi Shiwan. Can you provide a project which reproduces this issue? Your code looks correctly but it doesn’t show exact steps how this issue can be reproduced. Also can you provide detailed explanation about what is wrong with candlestick rendering? I took a look on your screenshot but I don’t see what’s wrong with it.
- You must login to post comments
Please login first to submit.

