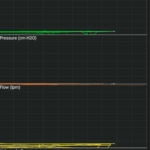
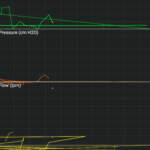
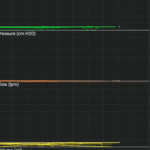
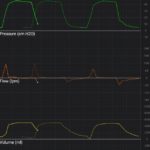
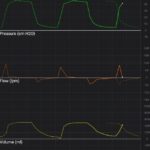
I am creating a chart to represent certain vitals. The code is almost identical to the Vitals Monitoring Demo application, the difference being
I added some Line and text annotations. I am appending points to the data series every 100ms. I have verified that the anomalous behavior is not caused due to wrong data being provided,
leading me to believe it must be a bug within SciChart. I have attached screenshots of this anomalous behavior. Any help would be greatly appreciated. Thank you.
Edit: This happens randomly, ie it performs normally without glitches on application startup but misbehaves after left running for a while.
I also observed that when I call .clear() on the XyDataSeries objects, the graph returns to normalcy, but only until FIFO_CAPACITY is reached. It then goes back to wreaking havoc.
I have added sample data (data.txt) to the question for reference, and screenshots of Expected behavior and the abnormal behavior in question.
Gif of the problem is here: https://imgur.com/7SO4DFb
Code used for setting up the chart:
     `SciChartBuilder sciChartBuilder;
     static ISciChartSurface chart;
     public final static XyDataSeries<Double, Double> pressureDataSeries = newDataSeries(FIFO_CAPACITY);
     public final static XyDataSeries<Double, Double> pressureSweepDataSeries = newDataSeries(FIFO_CAPACITY);
     public final static XyDataSeries<Double, Double> flowDataSeries = newDataSeries(FIFO_CAPACITY);
     public final static XyDataSeries<Double, Double> flowSweepDataSeries = newDataSeries(FIFO_CAPACITY);
     public final static XyDataSeries<Double, Double> volumeDataSeries = newDataSeries(FIFO_CAPACITY);
     public final static XyDataSeries<Double, Double> volumeSweepDataSeries = newDataSeries(FIFO_CAPACITY);
     public final static XyDataSeries<Double, Double> lastPressureSweepDataSeries = newDataSeries(1);
     public final static XyDataSeries<Double, Double> lastFlowDataSeries = newDataSeries(1);
     public final static XyDataSeries<Double, Double> lastVolumeDataSeries = newDataSeries(1);
     private static XyDataSeries<Double, Double> newDataSeries(int fifoCapacity) {
    final XyDataSeries<Double, Double> ds = new XyDataSeries<>(Double.class, Double.class);
    ds.setFifoCapacity(fifoCapacity);
    return ds;
}
 private void setUpChart() {                          // Called from onCreate()
    try {
        SciChartSurface.setRuntimeLicenseKey("");
    } catch (Exception e) {
        e.printStackTrace();
    }
    final String pressureId = "pressureId";
    final String flowId = "flowId";
    final String volumeId = "volumeId";
    SciChartBuilder.init(this);
    sciChartBuilder = SciChartBuilder.instance();
    chart = new SciChartSurface(this);
    LinearLayout chartLayout = findViewById(R.id.charts);
    chartLayout.addView((View) chart, 0);
    final NumericAxis xAxis = sciChartBuilder.newNumericAxis()
            .withVisibleRange(0, 10)
            .withAutoRangeMode(AutoRange.Never)
            .withAxisBandsFill(5)
            .withDrawMajorBands(true)
            .withAxisId("XAxis")
            .build();

    DoubleValues pressureRange = new DoubleValues(); pressureRange.add(-10); pressureRange.add(65);
    DoubleValues flowRange = new DoubleValues(); flowRange.add(-150); flowRange.add(+250);
    DoubleValues volumeRange = new DoubleValues(); volumeRange.add(-500); volumeRange.add(1000);

    final NumericAxis yAxisPressure = generateYAxis(pressureId, getMinMaxRange(pressureRange));
    final NumericAxis yAxisFlow = generateYAxis(flowId, getMinMaxRange(flowRange));
    final NumericAxis yAxisVolume = generateYAxis(volumeId, getMinMaxRange(volumeRange));

    UpdateSuspender.using(chart, new Runnable() {
        @Override
        public void run() {
            Collections.addAll(chart.getAnnotations(),
                    sciChartBuilder.newTextAnnotation()
                            .withXAxisId("XAxis")
                            .withYAxisId(pressureId)
                            .withY1(0d)
                            .withFontStyle(18, ColorUtil.White)
                            .withText(" Pressure (cm H2O)")
                            .build(),
                    generateBaseLines(pressureId),
                    sciChartBuilder.newTextAnnotation()
                            .withXAxisId("XAxis")
                            .withYAxisId(flowId)
                            .withY1(0d)
                            .withFontStyle(18, ColorUtil.White)
                            .withText(" Flow (lpm)")
                            .build(),
                    generateBaseLines(flowId),
                    sciChartBuilder.newTextAnnotation()
                            .withXAxisId("XAxis")
                            .withYAxisId(volumeId)
                            .withY1(0d)
                            .withFontStyle(18, ColorUtil.White)
                            .withText(" Volume (ml)")
                            .build(),
                    generateBaseLines(volumeId)
            );
            Collections.addAll(chart.getXAxes(), xAxis);
            Collections.addAll(chart.getYAxes(), yAxisPressure, yAxisFlow, yAxisVolume);
            Collections.addAll(chart.getRenderableSeries(),
                    MainActivity.this.generateLineSeries(pressureId, pressureDataSeries, sciChartBuilder.newPen().withColor(Color.parseColor("#00ff00")).withThickness(1.5f).build()),
                    MainActivity.this.generateLineSeries(pressureId, pressureSweepDataSeries, sciChartBuilder.newPen().withColor(Color.parseColor("#00ff00")).withThickness(1.5f).build()),
                    MainActivity.this.generateScatterForLastAppendedPoint(pressureId, lastPressureSweepDataSeries),

                    MainActivity.this.generateLineSeries(flowId, flowDataSeries, sciChartBuilder.newPen().withColor(Color.parseColor("#ff6600")).withThickness(1.5f).build()),
                    MainActivity.this.generateLineSeries(flowId, flowSweepDataSeries, sciChartBuilder.newPen().withColor(Color.parseColor("#ff6600")).withThickness(1.5f).build()),
                    MainActivity.this.generateScatterForLastAppendedPoint(flowId, lastFlowDataSeries),

                    MainActivity.this.generateLineSeries(volumeId, volumeDataSeries, sciChartBuilder.newPen().withColor(Color.parseColor("#FFEA00")).withThickness(1.5f).build()),
                    MainActivity.this.generateLineSeries(volumeId, volumeSweepDataSeries, sciChartBuilder.newPen().withColor(Color.parseColor("#FFEA00")).withThickness(1.5f).build()),
                    MainActivity.this.generateScatterForLastAppendedPoint(volumeId, lastVolumeDataSeries)
            );
            chart.setLayoutManager(new DefaultLayoutManager.Builder().setRightOuterAxesLayoutStrategy(new RightAlignedOuterVerticallyStackedYAxisLayoutStrategy()).build());
        }
    });
}

private HorizontalLineAnnotation generateBaseLines(String yAxisId) {
    return sciChartBuilder.newHorizontalLineAnnotation().withStroke(1, ColorUtil.White).withHorizontalGravity(Gravity.FILL_HORIZONTAL).withXAxisId("XAxis").withYAxisId(yAxisId).withY1(0d).build();
}

private NumericAxis generateYAxis(String id, DoubleRange visibleRange) {
    return sciChartBuilder.newNumericAxis().withAxisId(id).withVisibleRange(visibleRange).withAutoRangeMode(AutoRange.Never).withDrawMajorBands(false).withDrawMinorGridLines(true).withDrawMajorGridLines(true).build();
}
private FastLineRenderableSeries generateLineSeries(String yAxisId, IDataSeries ds, PenStyle strokeStyle) {
    FastLineRenderableSeries lineSeries = new FastLineRenderableSeries();
    lineSeries.setDataSeries(ds);
    lineSeries.setPaletteProvider(new DimTracePaletteProvider());
    lineSeries.setStrokeStyle(strokeStyle);
    lineSeries.setXAxisId("XAxis");
    lineSeries.setYAxisId(yAxisId);
    return lineSeries;
}
private IRenderableSeries generateScatterForLastAppendedPoint(String yAxisId, IDataSeries ds) {
    final EllipsePointMarker pm = sciChartBuilder.newPointMarker(new EllipsePointMarker())
            .withSize(4)
            .withFill(ColorUtil.White)
            .withStroke(ColorUtil.White, 1f)
            .build();

    return sciChartBuilder.newScatterSeries()
            .withDataSeries(ds)
            .withYAxisId(yAxisId)
            .withXAxisId("XAxis")
            .withPointMarker(pm)
            .build();
}

private static DoubleRange getMinMaxRange(DoubleValues values) {
    final DoubleRange range = new DoubleRange();
    SciListUtil.instance().minMax(values.getItemsArray(), 0, values.size(), range);
    range.growBy(0.1, 0.1);
    return range;
}

   // Appending to data series with:
    UpdateSuspender.using(MainActivity.chart, new Runnable() {
        @Override
        public void run() {
            MainActivity.pressureDataSeries.append(x, ppA);
            MainActivity.pressureSweepDataSeries.append(x, ppB);

            MainActivity.flowDataSeries.append(x, vFlowA);
            MainActivity.flowSweepDataSeries.append(x, vFlowB);

            MainActivity.volumeDataSeries.append(x, vtfA);
            MainActivity.volumeSweepDataSeries.append(x, vtfB);

            MainActivity.lastPressureSweepDataSeries.append(x, pp);
            MainActivity.lastFlowDataSeries.append(x, vFlow);
            MainActivity.lastVolumeDataSeries.append(x, vtf);
        }
    });
`
- Madhav Shroff asked 4 years ago
- last edited 4 years ago
 Data looks unsorted in X. Is it?
 other possibility is a resampling or FIFO data series bug but no-one else has reported this as of yet. If you can supply code as Yura asks we can look at it
 data in x is sorted from 0 to 10 and is reset to 0 after 10. I believe that is how it was done in the vitals example. Could that be the cause? I’d be happy to supply any code you need :D
 Well, data looks valid. May I ask how do you apppend data set like you have in file into data series? Where do ppA, ppB and other values come from? Since you’re using vital signs demo as base can you modify it to demonstrate the issue with data that you provided? Or maybe you can provide some other project which reproduces output like on screenshots/video that you provided?
 I tried a lot to replicate the error but no luck. I have a feeling it was a memory leak related problem. Once I identified and fixed some of those problems, the error went away. If I encounter it again, I’ll drop a comment here. Thank you for your help!
- 2 more comments
- You must login to post comments
Please login first to submit.
