Hi all,
Upfront apologies – I suspect this is a bit of a complicated set of information I’m looking for, as the UI specs are rather strict on what we’re looking for.
I’m getting to the last few functionalities I need to test, and I believe I’ve proof of concepted nearly everything I need. and I suspect I know what needs to be customized for my requirements. I wasn’t exactly sure how to implement some parts though, and the documentation for the android tick provider suggested that I look for assistance.
My remaining goals are to have an X-axis that is…
-
X-axis is above and below the top and bottom charts. I figure I can handle this dynamically by setting the axis visibility to true depending on which charts are visible – should be easy.
-
X-axis needs to be on 1 hour ticks (on the hour). The zoom range will go from 3 hours to 72 hours, and I will limit the pan to the nearest hour prior and after the current data. I assume I need to override tick provider. The x axis should look like 12:00 AM, 1:00 AM, 2:00 AM, 3:00 AM, and so forth. If the zoom is at 72 hours, it’ll show something like 12:00AM, 3:00AM, etc. I don’t think this part needs to be customized, and will automatically be handled by the default delta provider (Unless I’m mistaken, I can just specify max number of ticks on screen somewhere, and it’ll handle accordingly). – This one seems rather complicated.
-
I’d like to display the date on the 12:00AM entries of the x axis. As such, each “12:00 AM” tick will have “Jan 1” below it or the like. -Not sure how feasible this one is, and may push back on this requirement and skip it if it’s not doable.
Do you have an example of how to implement a custom tick provider/have any suggestions (also – please let me know if I’m barking up the wrong tree and I should be taking an entirely different approach).
Thanks!
-Andy
- Andrew Chin asked 5 years ago
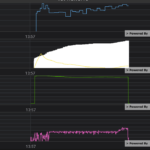
 Attached image is where I’m currently at. I’d like to get the 14:14, 23:23, etc. to be something like 14:00, 15:00, 16:00, 17:00, etc.
- You must login to post comments
Hi Andrew,
- Yeah this should be easy to do, just need to disable drawing of labels and axis ticks for desired axes. Alternative approach is to vertically stack yAxes in single chart.
- Have you tried to use Major/MinorDelta properties and set them to one day? Also you can take a look on this question which has small example of custom Delta and TickProvider
- You’ll need to customize LabelProvider to implement this part and format label based on dataValue (e.g. if it’s 12:00 AM return one string otherwise another string )
Best regards,
Yura
- Yura Khariton answered 5 years ago
- You must login to post comments
Hi Yura,
Thanks for the quick response!
I’m happy to hear 1 will be easy. I think I’m going to keep the charts separate, so that I can implement on press interactions for each of the charts (probably to expand them full screen).
For 2, I’ve tried setting major and minor deltas, and it’s always end up a bit funky for me.
My function for generating xAxis looks like
private fun generateXAxes(context: Context): CategoryDateAxis {


    var temp = CategoryDateAxis(context).apply {
        visibleRange = sharedRange
        autoRange = AutoRange.Never
        autoTicks = false
        drawMajorTicks = true
        drawMinorTicks = true
        drawMinorGridLines = true
        drawMajorBands = true
        setMaximumZoomConstrain(DateIntervalUtil.fromHours(6.0).toDouble())

        visibility = View.VISIBLE
        setMinorDelta(DateIntervalUtil.fromHours(1.0).toDouble())
        setMajorDelta(DateIntervalUtil.fromHours(1.0).toDouble())
    }
    temp.setVisibleRangeChangeListener(this)
    return temp
}
A bit odd is I only see the initial data point, instead of each of the intervals. I suspect something I’m doing here is off, and I plan to poke around at this a bit more. The dummy data I’m giving it also spans several hours, so I would expect to see at least a few points. That said, the further complication is that the single point I see is at 13:57 – the labels need to be on the hour, rather than representative of the scope of the data. Attached is a screenshot of what I currently have, given the parameters above. Maybe I can put a dummy entry at the hour prior with all 0s, and that might make the starting value 13:00 instead of 13:57. Definitely a bit more investigation for me to do here, though it still sounds like I might need to customize the tick provider as per the example you’ve provided.
For 3, that sounds awesome. I thought the x-axis requirements are a bit of an edge case, and I’m happy that I can customize it.
Thanks for pointing me in the right direction – I’ll poke around a bit more at major/minor delta and label providers, and see where I can get. If that doesn’t pan out, I’ll try customizing the tick, according to the example you provided.
Thanks again for the help!
-Andy
- Andrew Chin answered 5 years ago
 I noticed that code which you posted isn’t correct. You use CategoryDateAxis which is index based and operates with indices of data points instead of Date values ( when you set VisibleRange = (0, 10) on category axis it will display range of points which have indicies from 0 to 10 ). So for this type of axis MaximumZoomConstrain, Minor/MajorDelta values are interpreted as indices as well. For examples when you set MinorDelta DateIntervalUtil will return 3600000L for 1 hour which will be interpreted by axis as command to generate tick every 3600000 data points. That’s why you don’t see other ticks except one which is placed at 0 index, next tick will be generated at 3600000 point, after that at 7200000 point and so on.
 Whoops. Thanks – I suspect that’s core to 99% of the difficulties I’m working through. I’m switching over to DateAxis – I suspect life will be much easier now, thanks again :)
- You must login to post comments
Please login first to submit.


