Hi,
I am using Scichart android ,for Linking Chart Modifiers of Multiple charts I use these lines of code as shown below but it will not synchronize charts on X axis properley sometimes what is the reason ?
Is there is any other method to do that?
ModifierGroup chartModifiers2 = sciChartBuilder.newModifierGroup()
// Setting MotionEventsGroup
.withMotionEventsGroup(“SharedMotionEvents”).withReceiveHandledEvents(true)
.withLegendModifier().withShowCheckBoxes(true).withReceiveHandledEvents(true).build()
.withZoomPanModifier().withClipModeX(ClipMode.ClipAtExtents).withReceiveHandledEvents(true).build()
.withPinchZoomModifier().withReceiveHandledEvents(true).build()
.withZoomExtentsModifier().withReceiveHandledEvents(true).build()
.withRolloverModifier().withReceiveHandledEvents(true).build()
.build();
- sci chart asked 5 years ago
- You must login to post comments
Hi there,
Thanks for your question. Usually charts can go out of sync because they are rendered in separate threads and as result one chart can be presented on screen sooner than other, but in the end the should end up in the same position because modifiers in same group receive same events and use same code base so if starting conditions are the same they should end in same state after invoking modifiers. ‘
The only case when few charts in same group can go out of sync if they are different – have different sizes ( this may lead to different scrolling distance because of different amount of data per pixel ) or different modifiers ( e.g. if one chart has modifier which changes VisibleRange and other don’t – this can lead to different end states of chart ).
BTW if you want to synchronize charts to show same VisibleRange on several charts then you can create and assign same range instance for axes which should be synchronized like we do in our Sync multiple charts example. In this case you don’t need to use event groups because if modifier changes VisibleRange in one chart this value will be propagated to another chart.
DoubleRange sharedXRange = new DoubleRange(0d, 1d);
final IAxis xAxis1 = sciChartBuilder.newNumericAxis().withVisibleRange(sharedXRange).build();
final IAxis xAxis2 = sciChartBuilder.newNumericAxis().withVisibleRange(sharedXRange).build();
Best regards,
Yura
- Yura Khariton answered 5 years ago
 I use the same method but sometimes in my case synchronization outs. My code is here private val sharedDateRange = DateRange() val xAxis = sciChartBuilder.newDateAxis() .withGrowBy(0.1, 0.1) .withVisibleRange(sharedDateRange) .build() val yAxis = sciChartBuilder.newNumericAxis() .withGrowBy(0.1, 0.1) .withAxisAlignment(AxisAlignment.Left) .build() val chartModifiers = sciChartBuilder.newModifierGroup() // Setting MotionEventsGroup .withMotionEventsGroup(“SharedMotionEvents”).withReceiveHandledEvents(true) .withLegendModifier().withShowCheckBoxes(true).withReceiveHandledEvents(true).build() .withZoomPanModifier().withClipModeX(ClipMode.ClipAtExtents) .withClipModeY(ClipMode.ClipAtExtents).withReceiveHandledEvents(true).build() .withPinchZoomModifier().withReceiveHandledEvents(true).build() .withZoomExtentsModifier().withReceiveHandledEvents(true).build() .withRolloverModifier().withReceiveHandledEvents(true).build() .build()
- You must login to post comments
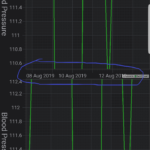
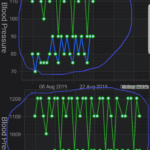
Screen Shot
- sci chart answered 5 years ago
 Unfortunately it’s hard to say why this happens without seeing the entire code. Can you attach a project which reproduces this issue so I can debug it on my PC?
 How we can share date Axis ?
 Hi there, have you seen our tutorial on linking multiple charts in Android? https://www.scichart.com/documentation/android/current/Tutorial%2009%20-%20Linking%20Multiple%20Charts.html
 yes , All modifiers are working properley but on DateAxis() which is xAxis it will not synchronize charts properley as shown in figure above
 Hi Yura Khariton , Below is the project which reproduces this issue
- You must login to post comments
Hi Yura Khariton,
Here is the project which reproduces this issue Kindly debug it and
give me a solution to overcome this problem.
Thanks.
- sci chart answered 4 years ago
- last edited 4 years ago
 Hi there, I’ve edited your reply and removed link to your project because it contains your license key. I would suggest you to remove previously uploaded project from Google Drive. In further please ensure that you don’t publish your license in publicly available sources
- You must login to post comments
Hi there,
In your example you need to create sharedXRange in MainActivity and pass that shared instance into all Charts ctors:
class MainActivity : AppCompatActivity() {

private val sharedXRange = DateRange()

fun chart() {
    for (i in 0..1) {
        charts[i] = Charts(this, sharedXRange)
        charts[i]!!.drawAxisData()
        binding?.lolChartContainer?.addView(charts[i])
    }
}

}
then store in Charts and use it for xAxis:
class Charts(context: Context, private val sharedXRange: DateRange) : FrameLayout(context)
{
private val binding: ChartsBinding
private val mContext: Context

fun drawAxisData()
{
    SciChartBuilder.init(mContext)
    val sciChartBuilder = SciChartBuilder.instance()
    val xBottomAxis = sciChartBuilder.newDateAxis()
        .withGrowBy(0.1, 0.1)
        .withVisibleRange(sharedXRange)
        .build()
}
}
Hope this will help you!
Best regards,
Yura
- Yura Khariton answered 4 years ago
 Hi Yura, Thank you so much for reviewing my code and giving quick reply , synchronization problem is solved but there are two more problems 1. Zooming speed between charts is increased very much but I want normal zooming speed as it is before. 2. I want all charts ClipmodeX property to ClipatExtents of a chart with maximum points as shown in figure how can I do that (For Example I have 9 charts 1 chart has 20 points and others have 10 points I want all the charts to clip at 20 points instead of 10 ) Thanks.
 Here is link of project https://drive.google.com/file/d/1uhRqBzkZGYYWXJe-Ya5Z6-eooB7tysGP/view?usp=sharing
 1. Please try to remove shared MotionEventsGroup – with synchronization via VisibleRange you don’t need to share events now. This will lead to processing events in both charts and because of shared VisibleRange this will lead to 2x scrolling. 2. We don’t support this functionality out of the box for ZoomPanModifier. ClipAtExtents was designed to stop scrolling at the extents of the data so to provide desired behavior you’ll need to either create custom axis and override calculations used by modifier for scrolling axis. Or more simple solution is just to add additional 10 points with NaN Y values which won’t be drawn by chart into those 8 charts which have 10 points
- You must login to post comments
Please login first to submit.


