Hello,
Is there a corresponding Documentation for the 3D Chart like this one for 2D Charts: https://www.scichart.com/example/wpf-chart-example-series-with-metadata/
What I am trying to do is to make some PointMarkers of the ScatterRenderableSeries3DViewModel in the 3D Chart bigger depending on the PointMetadata3D.
For 2D Charts I could accomplish that with the Documentation mentioned above. Now I want to do the same for 3D Charts.
Can someone give me a hint how to do that?
- Nick Müller asked 4 years ago
- You must login to post comments
Apologies, I kind of mis-read your question … Making scatter points bigger is easy in 3D
Take a look at The Bubble 3D Chart Type
The scaling is controlled by the PointMetadata3D.Scale property.
There is also an example here: https://www.scichart.com/example/wpf-3d-chart-example-simple-bubble-3d-chart/

- Andrew Burnett-Thompson answered 4 years ago
- You must login to post comments
Well that was kind of too easy, I just missed that Property of the PointMetadata3D class.
Thank you very much!
- Nick Müller answered 4 years ago
 No problem!
- You must login to post comments
Hi Nick
There is a custom point marker in 3D but it is limited to simple textures placed on a flat quad. For example we have a demo of this feature here:
WPF 3D Point Cloud Chart Example
    <!-- CustomPointMarker3D allows a VisualBrush, SolidColorBrush, ImageBrush etc... to be placed on a point-marker -->
    <s3D:CustomPointMarker3D x:Key="CustomPointMarkerResource">
        <s3D:CustomPointMarker3D.Brush>
            <VisualBrush>
                <VisualBrush.Visual>
                    <Canvas Width="512" Height="512" Background="Yellow" Grid.Row="1" HorizontalAlignment="Left">
                        <Ellipse Fill="Black" Width="75" Height="75" Canvas.Left="125" Canvas.Top="150"/>
                        <Ellipse Fill="Black" Width="75" Height="75" Canvas.Left="325" Canvas.Top="150"/>
                        <Path Stroke="Black" Data="M 125,300 S 225,400 325, 300" StrokeThickness="20" StrokeEndLineCap="Round" StrokeStartLineCap="Round" Canvas.Left="35" />
                    </Canvas>
                </VisualBrush.Visual>
            </VisualBrush>
        </s3D:CustomPointMarker3D.Brush>
    </s3D:CustomPointMarker3D>
This results in the following.
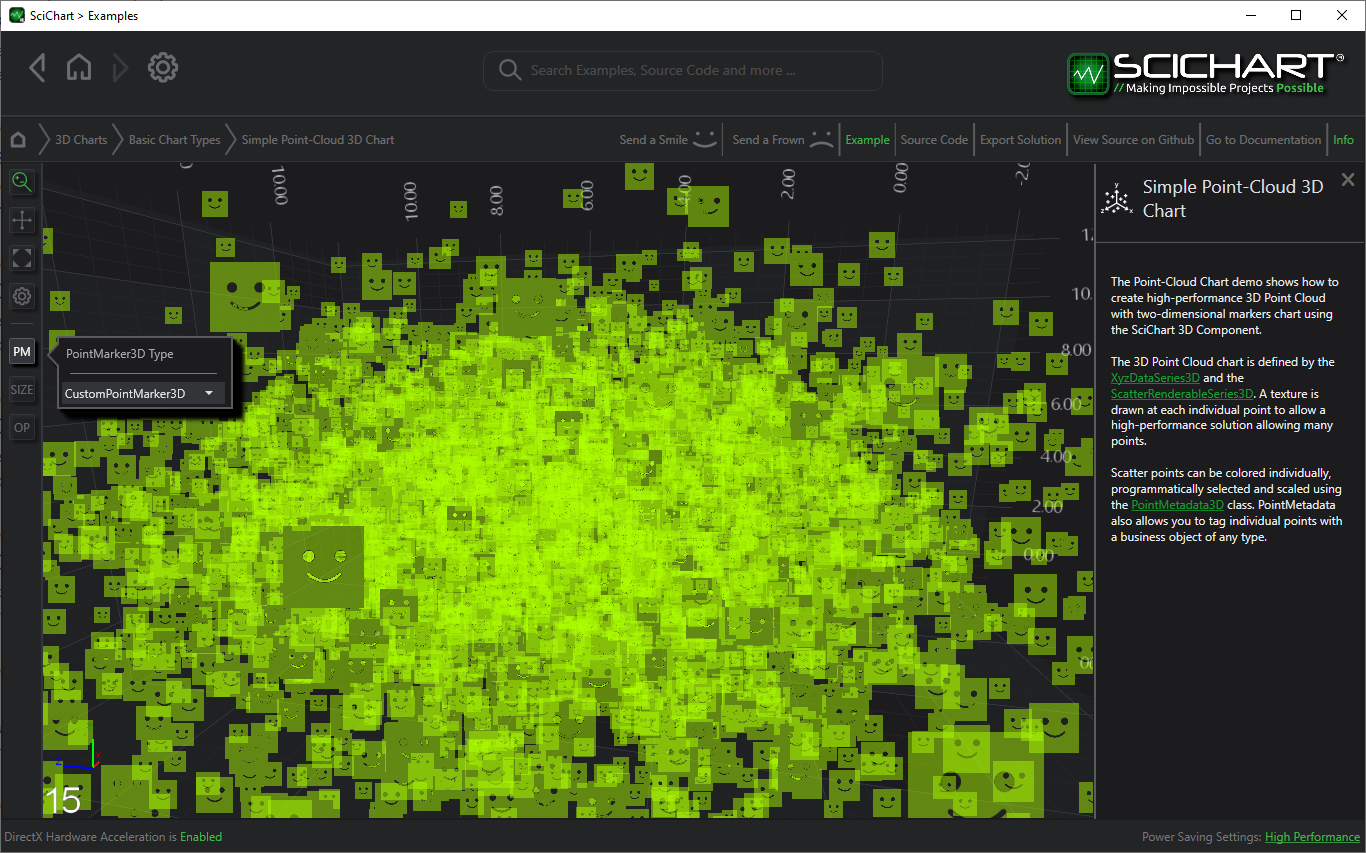
We don’t unfortunately have a method to change the pointmarker on a per-point basis in 3D Charts like how we do in 2D charts … You may have to log a feature request. Would you care to elaborate on your requirements a little bit more?
Best regards
Andrew
- Andrew Burnett-Thompson answered 4 years ago
- You must login to post comments
Please login first to submit.
