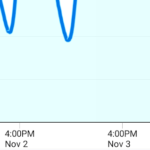
Hello,
I am wanting to “force” an axis label on a specific value. For example, right now in my datetime graph it always shows a “5PM” time on the axis regardless of the data. Instead, I would like to “anchor” the axis ticks on a different time value, like local Noon. We were able to do this in our previous charting solution, but I have not yet figured out how to do it with SciChart.
Thank you.
- C Bolton asked 3 years ago
- You must login to post comments
Hi there,
It looks like you need to create a custom TickProvider for your DateAxis. In case of date axis you need to provide list of minor/major ticks with double representation of Date’s time. Unfortunately I don’t fully understand what is desired output so I can’t provide code to achieve it, but hope that you’ll able to implement desire logic for generating axis ticks using our documentation.
Best regards,
Yura
- Yura Khariton answered 3 years ago
- You must login to post comments
Hello again,
I’m struggling with this one a bit still. By default, my app shows a 30-ish hour window. Scichart seems to always put the major tick mark on GMT midnight. I like everything scichart is doing with calculating where ticks relatively go, deltas, labels, etc. except for the default time it is using to calculate ticks from. For instance, I might choose to use local midnight instead of GMT midnight. I can easily convert my desired “anchor” time to a double, but am uncertain where to apply it.
Attached is a screenshot of current behavior. My local time is GMT-8 (we just switched to Standard from Savings time, which is why the default time on the axis was 5PM last week, and 4PM this week).
Do you have example code that does like this? I am unable to find anything.
Thank you.
- C Bolton answered 3 years ago
- last edited 3 years ago
 This happens because we use getTime() to get double representation of Date. Java documentation says that this method returns the number of milliseconds since January 1, 1970, 00:00:00 GMT. All calculations of ticks by default are performed without any timezone consideration. If you want to adjust tick generation and offset ticks you can create a custom TickProvider (https://www.scichart.com/documentation/android/current/webframe.html#Axis%20Ticks%20-%20TickProvider%20and%20DeltaCalculator%20API.html) and offset all generated ticks by desired amount of hours.
- You must login to post comments
Thanks for the quick response.
The documentation for this is unclear to me, and I am having trouble implementing.
If I do the following:
xAxis = DateAxis(this)
xAxis.tickProvider = CustomDateTickProvider()

class CustomDateTickProvider : DateTickProvider() {
protected override fun updateTicks(minorTicks: DoubleValues, majorTicks: DoubleValues) {
    super.updateTicks(minorTicks, majorTicks)
}
}
The above TickProvider gets called once, with empty values, the chart did not render, and system logged the error “E/SciChart Rendering Errors: SciChartSurface has no XAxes. Please ensure SciChartSurface.XAxis is set, or SciChartSurface.XAxes has at least one axis”
Just to see what happened, I also tried:
xAxis = DateAxis(this)
xAxis.tickProvider = CustomNumericTickProvider()

class CustomNumericTickProvider : NumericTickProvider(){
protected override fun updateTicks(minorTicks: DoubleValues, majorTicks: DoubleValues) {
super.updateTicks(minorTicks, majorTicks)
}
}
This UpdateTicks method was called twice, with the minortick values and majortick values empty the first time, but populated the second, and the chart rendered.
Should I be using the NumericTickProvider class instead of the DateTickProvider class with my DateAxis?
Thank you.
- C Bolton answered 3 years ago
 Error says that SciChartSurface has no XAxes. Did you add xAxis into chart’s XAxes collection? And no, by default we use DateTickProvider to calculate ticks for DateAxis, so it should work
- You must login to post comments
Hi there,
OK, I modified one of our examples to show how to create custom TickProvider for DateAxis:
public class MountainChartFragment extends ExampleBaseFragment {
@BindView(R.id.chart)
SciChartSurface surface;

@Override
protected int getLayoutId() {
    return R.layout.example_single_chart_fragment;
}

@Override
protected void initExample() {
    final IAxis xBottomAxis = sciChartBuilder.newDateAxis().withGrowBy(0.1d, 0.1d).build();
    final IAxis yRightAxis = sciChartBuilder.newNumericAxis().withGrowBy(0.1d, 0.1d).build();

    xBottomAxis.setTickProvider(new CustomDateTickProvider());

    final PriceSeries priceData = DataManager.getInstance().getPriceDataIndu(getActivity());
    final IXyDataSeries<Date, Double> dataSeries = sciChartBuilder.newXyDataSeries(Date.class, Double.class).build();
    dataSeries.append(priceData.getDateData(), priceData.getCloseData());

    final FastMountainRenderableSeries rSeries = sciChartBuilder.newMountainSeries()
            .withDataSeries(dataSeries)
            .withStrokeStyle(0xAAFFC9A8, 1f, true)
            .withAreaFillLinearGradientColors(0xAAFF8D42, 0x88090E11)
            .build();

    UpdateSuspender.using(surface, new Runnable() {
        @Override
        public void run() {
            Collections.addAll(surface.getXAxes(), xBottomAxis);
            Collections.addAll(surface.getYAxes(), yRightAxis);
            Collections.addAll(surface.getRenderableSeries(), rSeries);
            Collections.addAll(surface.getChartModifiers(), sciChartBuilder.newModifierGroupWithDefaultModifiers().build());

            sciChartBuilder.newAnimator(rSeries).withWaveTransformation().withInterpolator(new DecelerateInterpolator()).withDuration(3000).withStartDelay(350).start();
        }
    });
}

private static class CustomDateTickProvider extends DateTickProvider {
    private final double offset = DateIntervalUtil.fromHours(4);
    @Override
    protected void updateTicks(DoubleValues minorTicks, DoubleValues majorTicks) {
        super.updateTicks(minorTicks, majorTicks);

        offsetTicks(majorTicks, offset);
        offsetTicks(minorTicks, offset);
    }

    private static void offsetTicks(DoubleValues ticks, double offset) {
        final double[] tickItemsArray = ticks.getItemsArray();
        for (int i = 0, size = ticks.size(); i < size; i++) {
            tickItemsArray[i] += offset;
        }
    }
}
}
Hope this will help you!
Best regards,
Yura
- Yura Khariton answered 3 years ago
 Thank you. That cleared up some things.
- You must login to post comments
Please login first to submit.

