Hello,
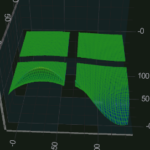
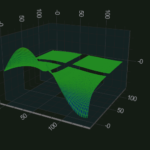
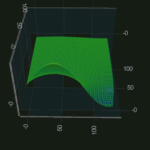
I have a problem with the 3D surface chart. I have used the 3D example from the Example Tutorial as an example. As soon as I make xSize and ySize larger than 128, a gap appears in the respective axes.
Is it possible that these sizes are limited? Or have I made a mistake?
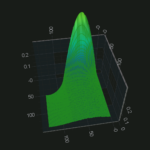
In the attachment you will find the resulting pictures.
The good one has an xSize and ySize of 128 and the bad one 129.
- Willi Schüler asked 3 years ago
- last edited 3 years ago
- You must login to post comments
Hi Willi,
I’m not aware of such limitations. I tried to run one of demo examples with latest version and increased mesh size from 25×25 to 250×250. Everything seems to work as it should and there are no gaps in mesh.
Can you provide full project which reproduces this issue? Have you tried to run your app on different device?
Best regards,
Yura
- Yura Khariton answered 3 years ago
- You must login to post comments
hello
thank you for the quick reply.
I could fix the problem after your answer. It was due to the version I was using (3.0.0.4253).
With a more recent version, there were no gaps. (4.0.0.4449).
I also tried the latest version and unfortunately the app always crashed. (4.2.0.4557)
Gradle
implementation (group: 'com.scichart.library', name: 'core', version: '4.2.0.4557', ext: 'aar')
implementation (group: 'com.scichart.library', name: 'data', version: '4.2.0.4557', ext: 'aar')
implementation (group: 'com.scichart.library', name: 'drawing', version: '4.2.0.4557', ext: 'aar')
implementation (group: 'com.scichart.library', name: 'charting3d', version: '4.2.0.4557', ext: 'aar')
implementation (group: 'com.scichart.library', name: 'charting', version: '4.2.0.4557', ext: 'aar')
implementation (group: 'com.scichart.library', name: 'extensions', version: '4.2.0.4557', ext: 'aar')
implementation (group: 'com.scichart.library', name: 'extensions3d', version: '4.2.0.4557', ext: 'aar')
Activity
class PlotCPCSurface : AppCompatActivity() {
    override fun onCreate(savedInstanceState: Bundle?) {
        super.onCreate(savedInstanceState)
        setContentView(R.layout.activity_plot_c_p_c_surface)

//        val cpc: CPCAnalyseRecord = LoadAnalyse.load(filesDir)

        SciChartBuilder.init(this);
        SciChart3DBuilder.init(this);

        var sciChart3DBuilder = SciChart3DBuilder.instance()
        var surface3d: SciChartSurface3D = findViewById<View>(R.id.cpcSurface) as SciChartSurface3D


        val camera: Camera3D = sciChart3DBuilder.newCamera3D().build()

        val xAxis: NumericAxis3D = sciChart3DBuilder.newNumericAxis3D().withGrowBy(.1, .1).build()
        val yAxis: NumericAxis3D =
            sciChart3DBuilder.newNumericAxis3D().withGrowBy(.1, .1).build()
        val zAxis: NumericAxis3D = sciChart3DBuilder.newNumericAxis3D().withGrowBy(.1, .1).build()
        val xSize = 165
        val zSize = 256
        val ds = UniformGridDataSeries3D(
            Double::class.javaObjectType,
            Double::class.javaObjectType,
            Double::class.javaObjectType, xSize, zSize
        )

        for (x in 0 until xSize) {
            for (z in 0 until zSize) {
//                val y = abs(cpc.cpc[x][z])
                val xVal = 25.0 * x / xSize
                val zVal = 25.0 * z / zSize
//                val y = abs(cpc.cpc[x][z])
                val y = Math.sin(xVal * .2) / ((zVal + 1) * 2)
//                ds.updateYAt(x, z, 1.0)
                ds.updateYAt(x, z, y)
            }
        }

        val colors = intArrayOf(
            ColorUtil.DarkBlue,
            ColorUtil.Blue,
            ColorUtil.Cyan,
            ColorUtil.GreenYellow,
            ColorUtil.Yellow,
            ColorUtil.Red,
            ColorUtil.DarkRed
        )
        val stops = floatArrayOf(0f, .1f, .3f, .5f, .7f, .9f, 1f)
        val stroke = 0x77228B22
        val rs: SurfaceMeshRenderableSeries3D = sciChart3DBuilder.newSurfaceMeshSeries3D()
            .withDataSeries(ds)
            .withDrawMeshAs(DrawMeshAs.SolidWireframe)
            .withStroke(stroke)
            .withContourStroke(stroke)
            .withStrokeThicknes(1f)
            .withDrawSkirt(false)
            .withMeshColorPalette(GradientColorPalette(colors, stops))
            .build()

        UpdateSuspender.using(surface3d) {
            surface3d.setCamera(camera)
            surface3d.setXAxis(xAxis)
            surface3d.setYAxis(yAxis)
            surface3d.setZAxis(zAxis)
            surface3d.getRenderableSeries().add(rs)
            surface3d.getChartModifiers()
                .add(sciChart3DBuilder.newModifierGroupWithDefaultModifiers().build())
        }
    }
}
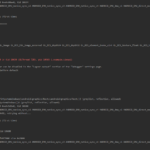
The image shows the log during the crash.
Mabye it can help your team to fix it.
I can work with the other version.
- Willi Schüler answered 3 years ago
 Can you provide entire project which reproduces this issue? I tried to reproduce it on my PC, but without any success.
- You must login to post comments
