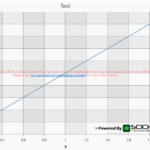
I am currently following the tutorial at the page listed here.
Instead of using the given values to add to the series, I am using very small values like so:
var lineData = new XyDataSeries<double, double>() { SeriesName = "Testing Series" };
lineData.Append(0, 0);
lineData.Append(1, 0.001);
lineData.Append(2, 0.002);
However the axis ticks do not display a high enough resolution as shown in the image attached. Each one will show either 0, 0.001 or 0.002 and no further. I have tried changing the axis MinorDelta and MajorDelta to smaller values but this has not worked. Is there any way to fix this?
- Hamza Butt asked 2 years ago
- last edited 2 years ago
- You must login to post comments
Hi Hamza
What you need to do is to use the Axis.TextFormatting property to adjust the resolution of axis labels.
See this article on the WPF Chart Documentation
Best regards
Andrew
- Andrew Burnett-Thompson answered 2 years ago
- You must login to post comments
Please login first to submit.

