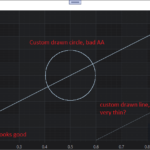
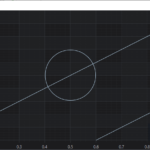
I’m overriding FastLineRenderableSeries so I can do some custom rendering.
I have a data series defined as :
 var xyDataSeries = new XyDataSeries<double>();
            xyDataSeries.Append(0, 0);
            xyDataSeries.Append(1, 1);
Test.DataSeries = xyDataSeries;
and my chart as :
<s:SciChartSurface Loaded="SciChartSurface_Loaded">
        <s:SciChartSurface.RenderableSeries>
            <customSeriesMvvmExample:FastLineRenderableSeriesEx x:Name="Test" />
        </s:SciChartSurface.RenderableSeries>
        <s:SciChartSurface.XAxis>
            <s:NumericAxis/>
        </s:SciChartSurface.XAxis>
        <s:SciChartSurface.YAxis>
            <s:NumericAxis/>
        </s:SciChartSurface.YAxis>
    </s:SciChartSurface>
And then I override InternalDraw :
public class FastLineRenderableSeriesEx : FastLineRenderableSeries
{
    protected override void InternalDraw(IRenderContext2D renderContext, IRenderPassData renderPassData)
    {
        base.InternalDraw(renderContext, renderPassData);

        using (var brush = renderContext.CreateBrush(Colors.Transparent))
        using (var pen = renderContext.CreatePen(Stroke, true, StrokeThickness, Opacity))
        {

            var xCalc = renderPassData.XCoordinateCalculator;
            var yCalc = renderPassData.YCoordinateCalculator;

            var xCoord = xCalc.GetCoordinate(0.5);
            var yCoord = yCalc.GetCoordinate(0.5);

            renderContext.DrawEllipse(pen, brush, new System.Windows.Point(xCoord, yCoord), 150, 150);

            renderContext.DrawLine(pen,
                new System.Windows.Point(xCalc.GetCoordinate(0.6), yCalc.GetCoordinate(0)),
                new System.Windows.Point(xCalc.GetCoordinate(2), yCalc.GetCoordinate(1.4)));
        }
    }
}
The problem is that the base.InternalDraw draws the original data series line very nicely with anti-aliasing, but the custom circle I draw has no AA, and the custom line I draw looks very thin?
what’s going on here?
- forl forl asked 11 months ago
- last edited 11 months ago
 It seems that selecting a different render surface such as XamlRenderSurface seems to improve the quality. HighQualityRenderSurface also improves the quality but is noticeably slower when resizing the window. VisualXcceleratorRenderSurface doesn’t seem to make a difference, but already seems to be the default for me when I don’t manually set a surface (checked with the debugger)
 It seems as though I am not able to post answers? Basically, I was just wanting to experiment with creating my own RenderableSeries. I wanted to create something that was capable of rendering 1000’s of randomly shaped polygons to see how the performance would stack up. As we need a chart that is kind of like a scatter plot, but each marker will be a different shape of polygon. However, it seems as though even with FillPolygon you don’t get AA. Unless you use a XamlSurface, and then performance is really bad. Should I instead be using a XyScatterRenderableSeries? I notice that with the XyScatterRenderableSeries, the EllipsePointMarker is nicely AA’d? If so, what is the most efficient method to draw 1000’s of polygons onto a XyScatterRenderableSeries? I assume I would use a SpritePointMarker? …but then how would I do hit test detection for a tooltip? Is it possible to have the markers remain the same size when you zoom? .. i.e, when you zoom in closer, they get bigger? As the user zooms in, I want the user to be able to get a bigger view of the polygon.
- You must login to post comments
hmm, I seem to have found a solution. By enabling a HighQualityRenderSurface or a XamlRenderSurface, the quality is massively improved. HighQualityRenderSurface is very slow though. XamlRenderSurface seems faster.
VisualXcceleratorRenderSurface doesn’t seem to make a difference.
I am not sure why I need to change the surface though, given that the first line as shown in my first post was rendered fine using base.InternalDraw.
- forl forl answered 11 months ago
- last edited 11 months ago
- You must login to post comments
Hi Fori,
Before I go into possible solutions I’d like to know what you are trying to do? It’s possible that your requirements could be solved by our Annotations API, or custom pointmarkers depending on the use-case.
The four renderer plugins in SciChart have different properties and allow you to select or balance between quality and performance. VisualXcceleratorRenderSurface’s IRenderContext2D exposes DrawEllipse() to be compatible with the other renderers but we don’t actually use it for our own chart drawing – instead we’re doing lower level operations on a GPU. Hence why the antialiasing doesn’t look great – its not a very commonly used code path.
For the very thin line, try setting a thicker StrokeThickness. Even though a FastLineRenderableSeries has a StrokeThickness = 1, for quality we actually send 1.5f to the renderer. Try StrokeThickness 1.5f or 2.0f when creating your Pen in line 8 of your sample above. Does that help?
If that helps 2D lines, for the Ellipse, what I would suggest is a workaround. Try to find a maths func such as this to compute the 2D points to draw a circle/ellipse then feeding that into DrawLines(). You can control the quality there by setting the stepping (and control the number of points in the ellipse).
Lastly I do recommend telling us more about what you want to achieve. There could be another path or solution which solves this more elegantly.
Best regards
Andrew
- Andrew Burnett-Thompson answered 11 months ago
- You must login to post comments
Hello,
Basically, I was just wanting to experiment with creating my own RenderableSeries. I wanted to create something that was capable of rendering 1000’s of randomly shaped polygons to see how the performance would stack up. As we need a chart that is kind of like a scatter plot, but each marker will be a different shape of polygon.
However, it seems as though even with FillPolygon you don’t get AA. Unless you use a XamlSurface, and then performance is really bad.
Should I instead be using a XyScatterRenderableSeries? I notice that with the XyScatterRenderableSeries, the EllipsePointMarker is nicely AA’d?
If so, what is the most efficient method to draw 1000’s of polygons onto a XyScatterRenderableSeries? I assume I would use a SpritePointMarker? …but then how would I do hit test detection for a tooltip?
Is it possible to have the markers remain the same size when you zoom? .. i.e, when you zoom in closer, they get bigger? As the user zooms in, I want the user to be able to get a bigger view of the polygon.
- forl forl answered 11 months ago
- last edited 11 months ago
 Hi Fori, I’ve +voted some of your Q&A so you should now have enough reputation to post answers. Randomly shaped polygons. Is that what your application is going to do? If not then this isn’t a real test of SciChart’s capabilities. Could you tell us what your application requirements are?
- You must login to post comments
Please login first to submit.


